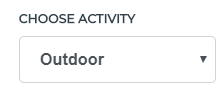
It contains information about three main mobile operators: Telenor, Telekom Srbija and Vip mobile divided into three location types. You can choose from the following activities:
To define which activity you want to see, please choose from a dropdown menu at the top of the web page.
The information is spread across variety of tests, such as:
In order to choose which test results you want to see, please choose from a dropdown menu at the top of the web page.

Each test can be displayed for three main Aggregations:
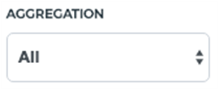
After choosing one of the Aggregations, you can further choose which particular (single) location results you would like to see, for example:
Voice test for:
a) Small City - Paraćin
b) Large City - Beograd
c) Road - Vranje - Bujanovac

Finally, you can filter the results by choosing from Technology Filter (All, Mixed, 2G, 3G, 4G).
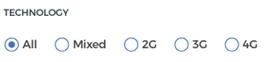
Availability of filters depends on the test type, so it will not be always possible to filter results with all filters. If filter is not applicable, it will be faded out to inform you that you cannot use it on this particular type of test.
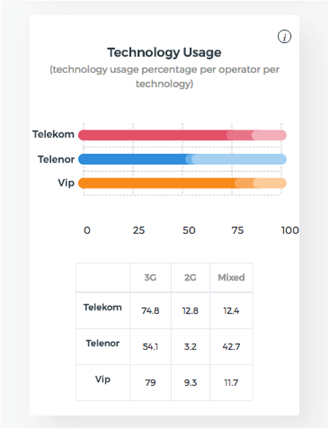
Each test contains its own chart types which display global results for each operator (these results ARE NOT an average from all areas measured), which you can see on the left-hand side of the screen. Each chart is described precisely to inform you what kind of data it contains, how it is measured (units) and how to interpret the data.
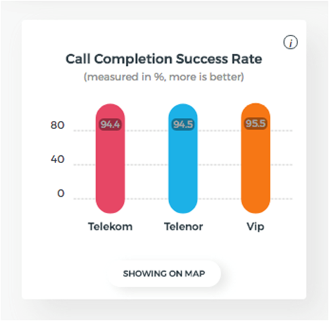
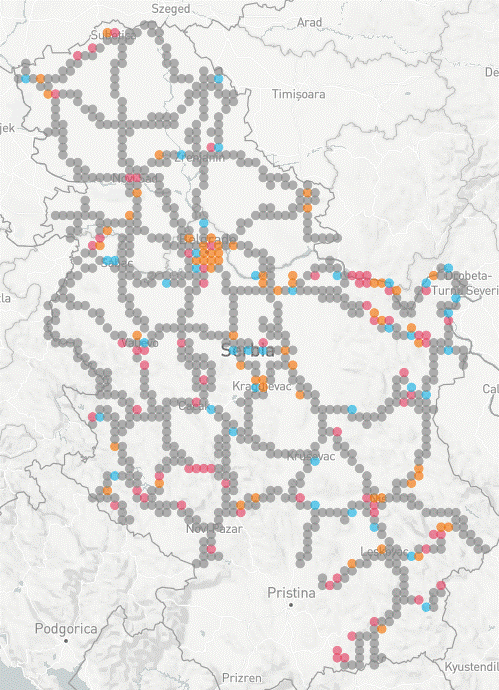
You can choose which chart results should be displayed on map by clicking the „Show on map” button.

The map will automatically update with results, which are displayed in form of circles, coloured after Operator’s main brand colour. The grey colour is presented in areas where at least two Operators have the same best result.
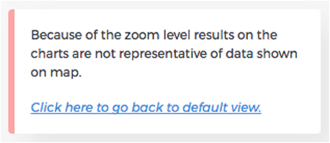
Map can be zoomed in/out, but please keep in mind that, at some point of zooming, the information displayed will not be accurate. If that occurs, you will be informed about that with a popup window on the left hand side of the web page, right above the filter charts.
By clicking on any circle you will see a popup window displaying results for this particular area.
Additionally, in some cases you can display information about Dropped and Failed calls by choosing so in the bottom left corner of the map.

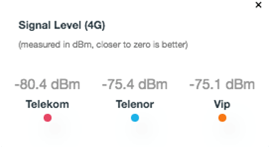
In case of Radio Coverage test for an individual operator, you will be presented with data showing quality of Signal Level. The circles on the map will have Red (Excellent), Yellow (Good), Green (Fair) and Grey (Poor) colours, to inform you of the signal level in any particular area of the chosen location.
Additionally, you will be presented with description on how to interpret the colours on the map.
