Please note that in order to distinguish two campaigns’ results compared, the following shade code was used. The lighter bar colour was used to represent 2017 results and darker for 2018 results. The example is presented in Figure 1.
Fig. 1. Year to year comparison shades codes
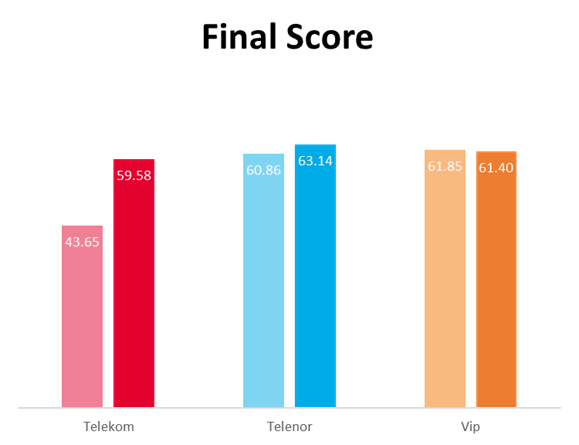
Fig. 2. Final scores comparison
Telenor scored the best in 2018 mainly due to big improvement of voice service quality. Telekom Srbija had the biggest improvement, thanks to better quality of data services across the aggregations compared to the previous campaign. Vip mobile achieved slightly lower score than in 2017 because of lower score points achieved on Roads.
The trend analysis of Voice scorings and Data scorings are presented in Figure 3 and Figure 4. Please note that Final Score is the sum of Voice and Data score.
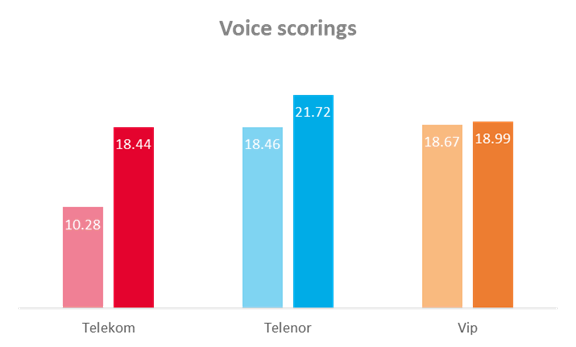
Fig. 3. Final scores comparison
All operators improved the quality of Voice service over the year. Telenor scored the best with the best Voice quality across all aggregations. Telekom Srbija made the biggest improvement across all aggregations.
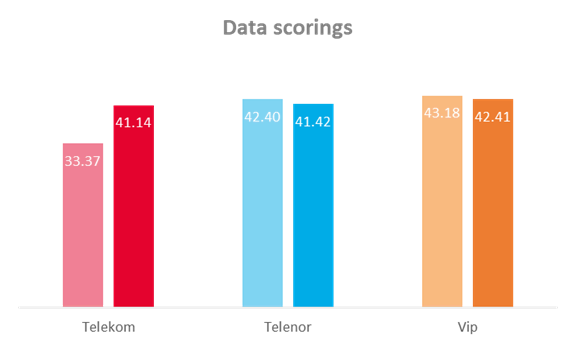
Fig. 4. Final scores comparison
Telekom Srbija was the only mobile operator that improved Data services quality. Telenor and Vip mobile scored lower than in 2017 mainly due to lower results on Roads.
The trend analysis of Large Cities scorings, Small Cities scorings and Roads scorings are presented in Figure 5, Figure 6 and Figure 7. Please note that Final Score is the sum of Large Cities score, Small Cities score and Roads score.
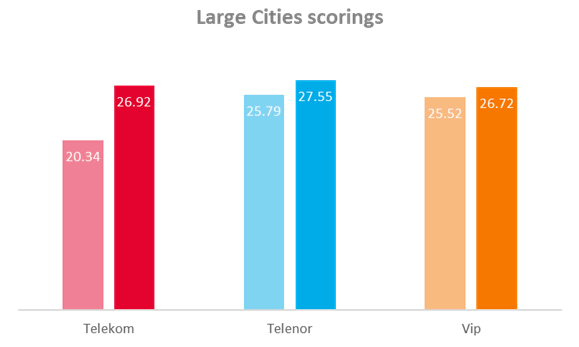
Fig. 5. Large Cities scores comparison
All mobile operators improved quality of service in Large Cities. Telenor scored the best in this aggregation, having general improvement across most of data transmission KPIs. The biggest improvement has been noticed for the Telekom Srbija network with much better Voice quality than in previous campaign in 2017.
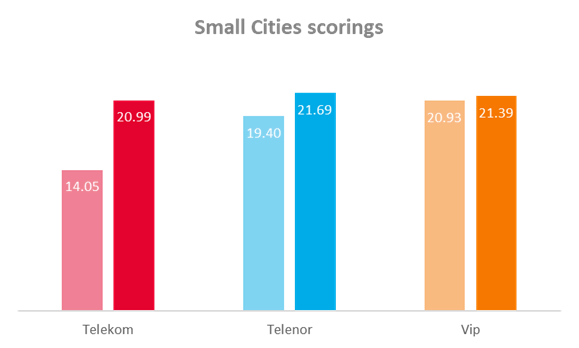
Fig. 6. Small Cities scores comparison
The quality of services improved in Small Cities for all mobile operators. Telenor scored the best mainly due to better Voice service quality than the competitors. Telekom Srbija had the biggest improvement with better KPIs across all test types.
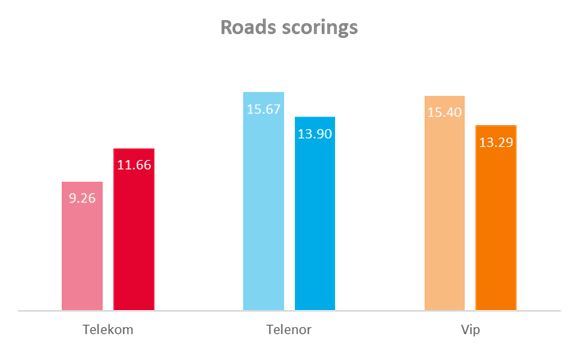
Fig. 7. Roads scores comparison
Telekom Srbija was the only mobile operator that improved the quality of services on the Roads. The improvement was seen across most of the KPIs measured. Despite the lower score than in 2017, Telenor scored the best mainly due to achieving better quality of data services than competitors.
Voice
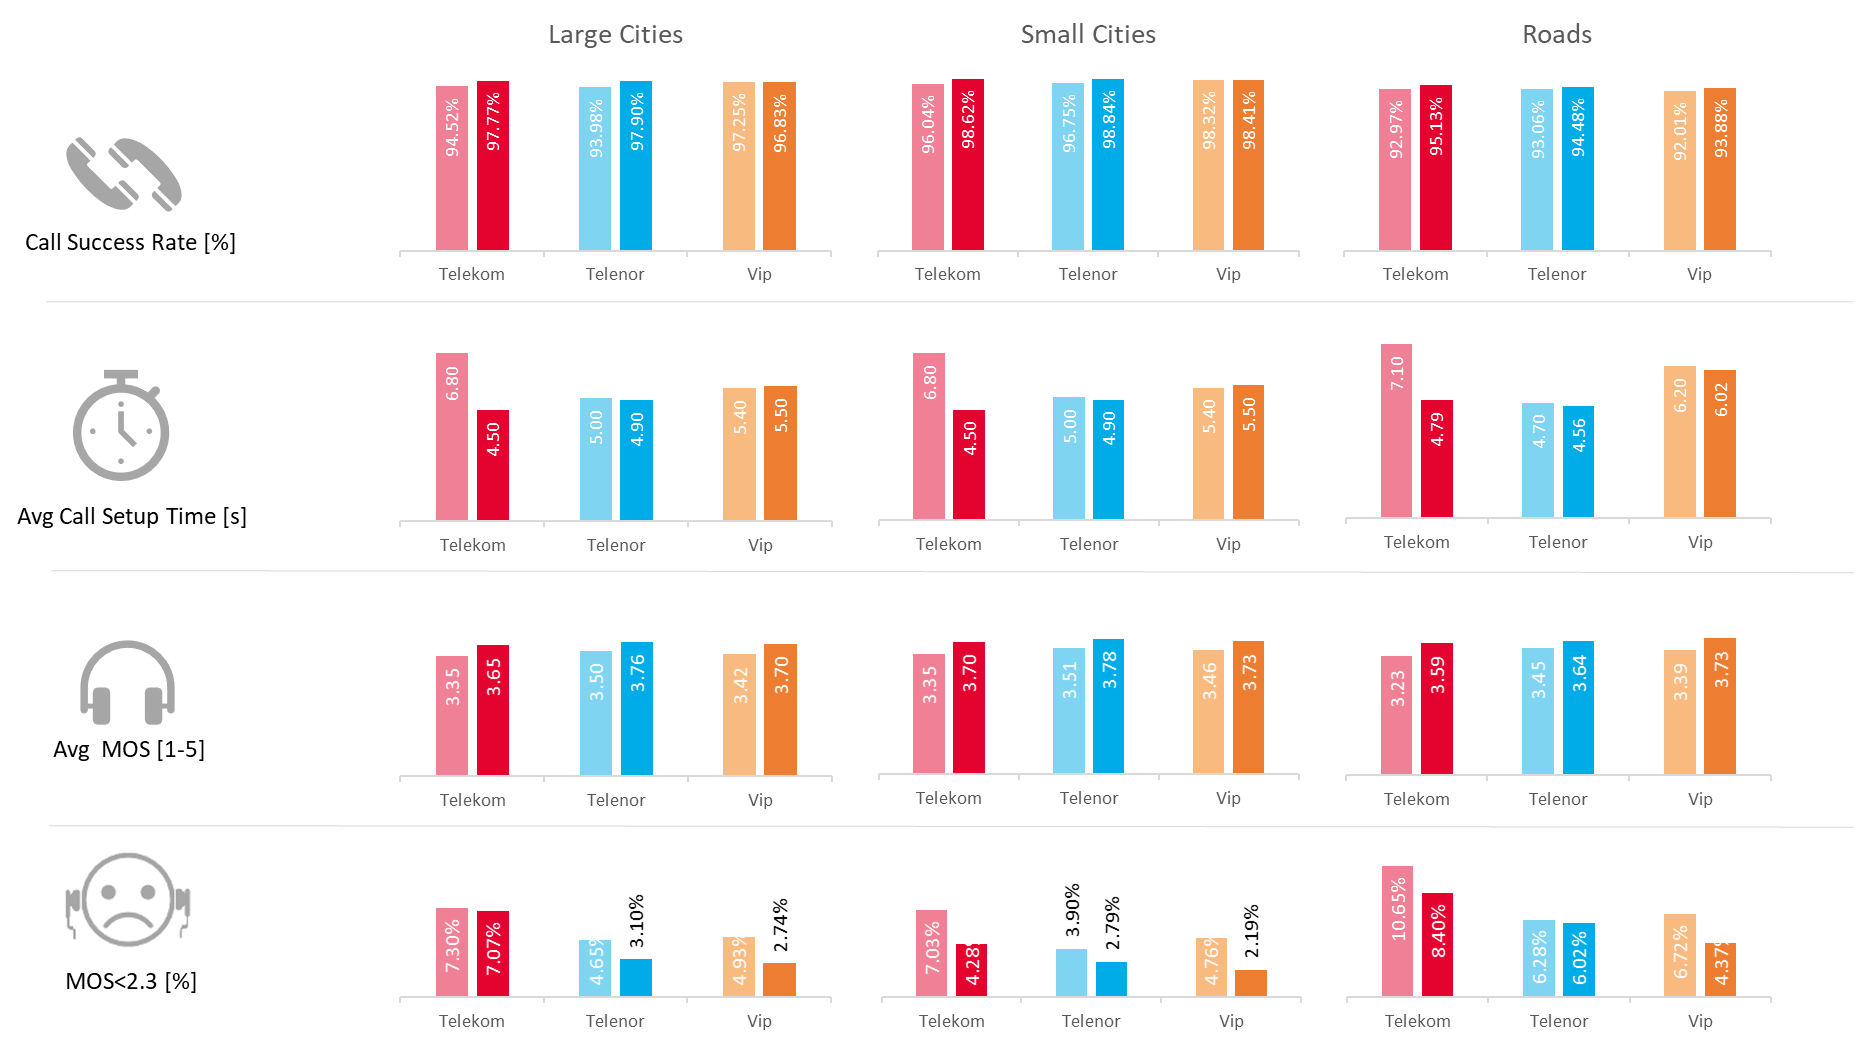
Fig. 8. Selected KPIs from voice tests
Call Success Rate: Telekom Srbija and Telenor improved their success rate in city aggregations by about 3%, catching up to Vip mobile, which remained on a very similar level. On Roads, all operators slightly increased their success rates.
Average Call Setup Time: The most noticeable difference is visible in Telekom Srbija, which improved greatly and surpassed the competition in all aggregations. The other two operators had results on a very similar level for all aggregations
Average MOS score: The perceived voice quality score has improved by 0.2-0.3 for all operators in all aggregations.
% of MOS score below 2.3: In Large cities, Telenor and Vip mobile improved noticeably when it comes to the number of samples with poor speech quality. In Small Cities, all operators improved by having 2-3% less bad samples than previous year. On Roads, the biggest improvement, by over 2%, was achieved by Telekom Srbija and Vip mobile. Telenor improved very slightly.
FDTT HTTP DL
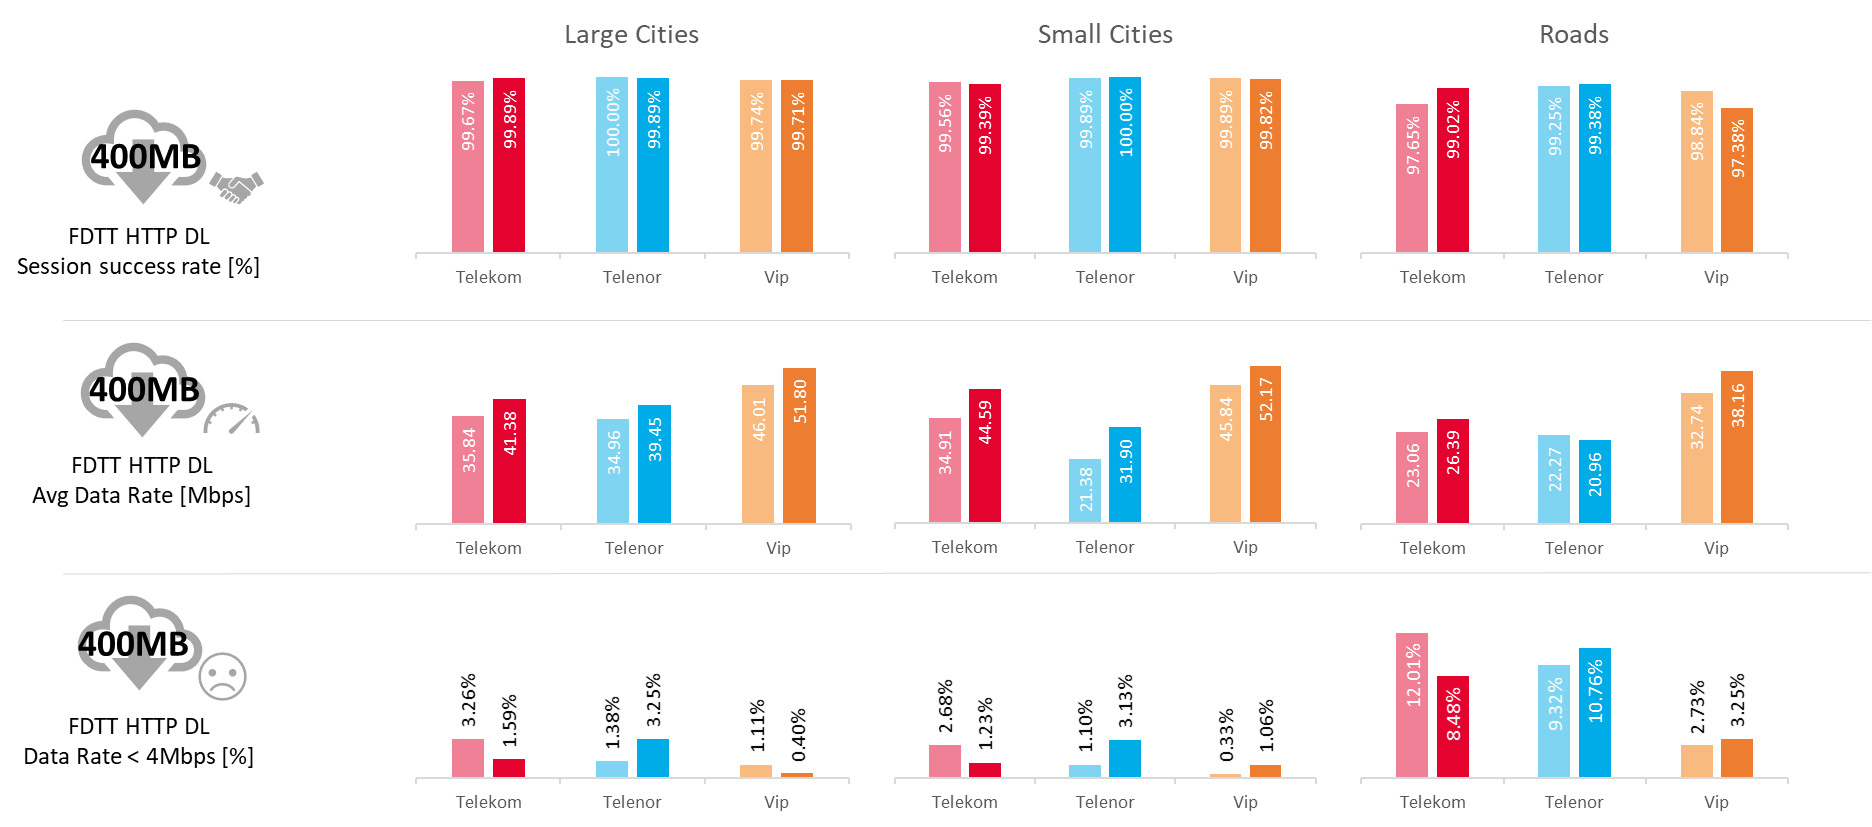
Fig. 9. Selected KPIs from FDTT HTTP DL tests
Session Success Rate provides information about reliability of Internet access for mobile users. During the 2017 benchmarking campaign, all operators provided close to excellent results (>99%) for Large & Small cities. The level of quality of service was maintained in 2018 for Large & Small cities and slightly improved in case of Roads.
Average Data Rates measured during the 2018 benchmark were improved by all operators by 5 – 6 Mbps in case of Large Cities, 7 Mbps – 10 Mbps in case of Small Cities. On measured Roads, Telekom Srbija improved its result by 3 Mbps, Vip mobile by 6 Mbps. Telenor is the only operator which noted a decrease by 2 Mbps. Results achieved during 2018 are satisfactory to provide even those demanding mobile services like media streaming.
Percentage of Tests with Data Rate below 4 Mbps is a metric which describes portion of the network not satisfying the criteria for minimal user satisfaction for Internet connectivity. In such areas, users may have troubles with demanding services like downloading video streams, as well as bulk large downloads. Compared to 2017, Telekom Srbija improved in all categories, Vip mobile improved in Large Cities and deteriorated in Small Cities and Roads. Telenor deteriorated in all categories. Despite this fact, this year all operators provided satisfactory percentage in Large and Small Cities. In Roads category, Vip mobile provided over 96% of measured tests with data rate greater than 4 Mbps, which is the best result of all Serbian operators.
FDTT HTTP UL
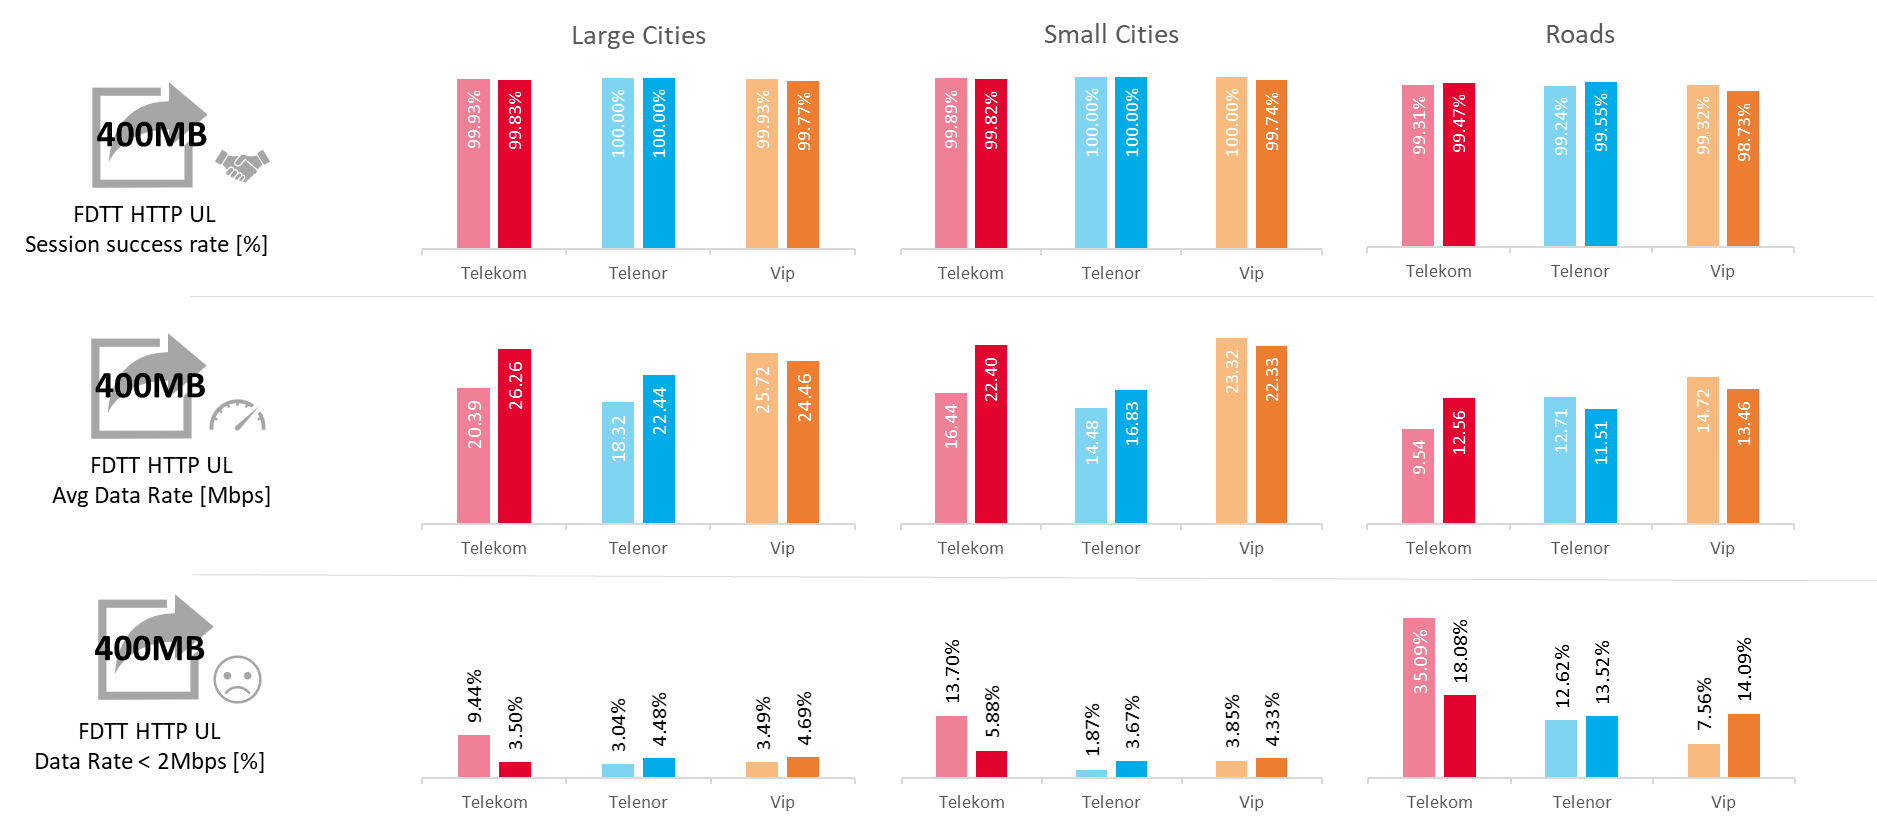
Fig. 10. Selected KPIs from FDTT HTTP UL tests
Session Success Rate provides information about reliability of Internet access for mobile users. Performance of all operators has remained stable and on excellent level since 2017. While Telenor scored slightly higher than competitors, the difference is not perceptible to typical users.
Average Data Rates measured during the 2018 benchmark confirmed improvement in Large Cities and Small Cities for Telekom Srbija (+6 Mbps) and Telenor (+4 Mbps in Large Cities, + 2 Mbps in Small Cities). Vip mobile results remained on stable level with small decrease in Large Cities (-1 Mbps) and improvement in Small Cities (+1 Mbps). On Roads, all operators presented similar results with Vip mobile leading and Telekom Srbija holding second place.
Percentage of Tests with Data Rate below 2 Mbps is a metric which describes portion of the network not satisfying the criteria for minimal user satisfaction for Internet connectivity. In such areas, users may have troubles with demanding services like uploading photos, video streams, to social media platforms, as well as bulk large uploads. Telenor and Vip mobile showed the trend of increasing areas of data rate below 2 Mbps. In contrast, Telekom Srbija made a significant progress with decreasing area of data rate below 2 Mbps for Large Cities by 6 percentage points (pp), Small Cities by 7 pp and Roads by 17 pp. Despite this improvement, Telenor and Vip mobile had advantage over Telekom Srbija. While performance of all operators was satisfactory in Large and Small Cities, the results for Roads category may cause user dissatisfaction and should be improved further.
HTTP Transfer DL
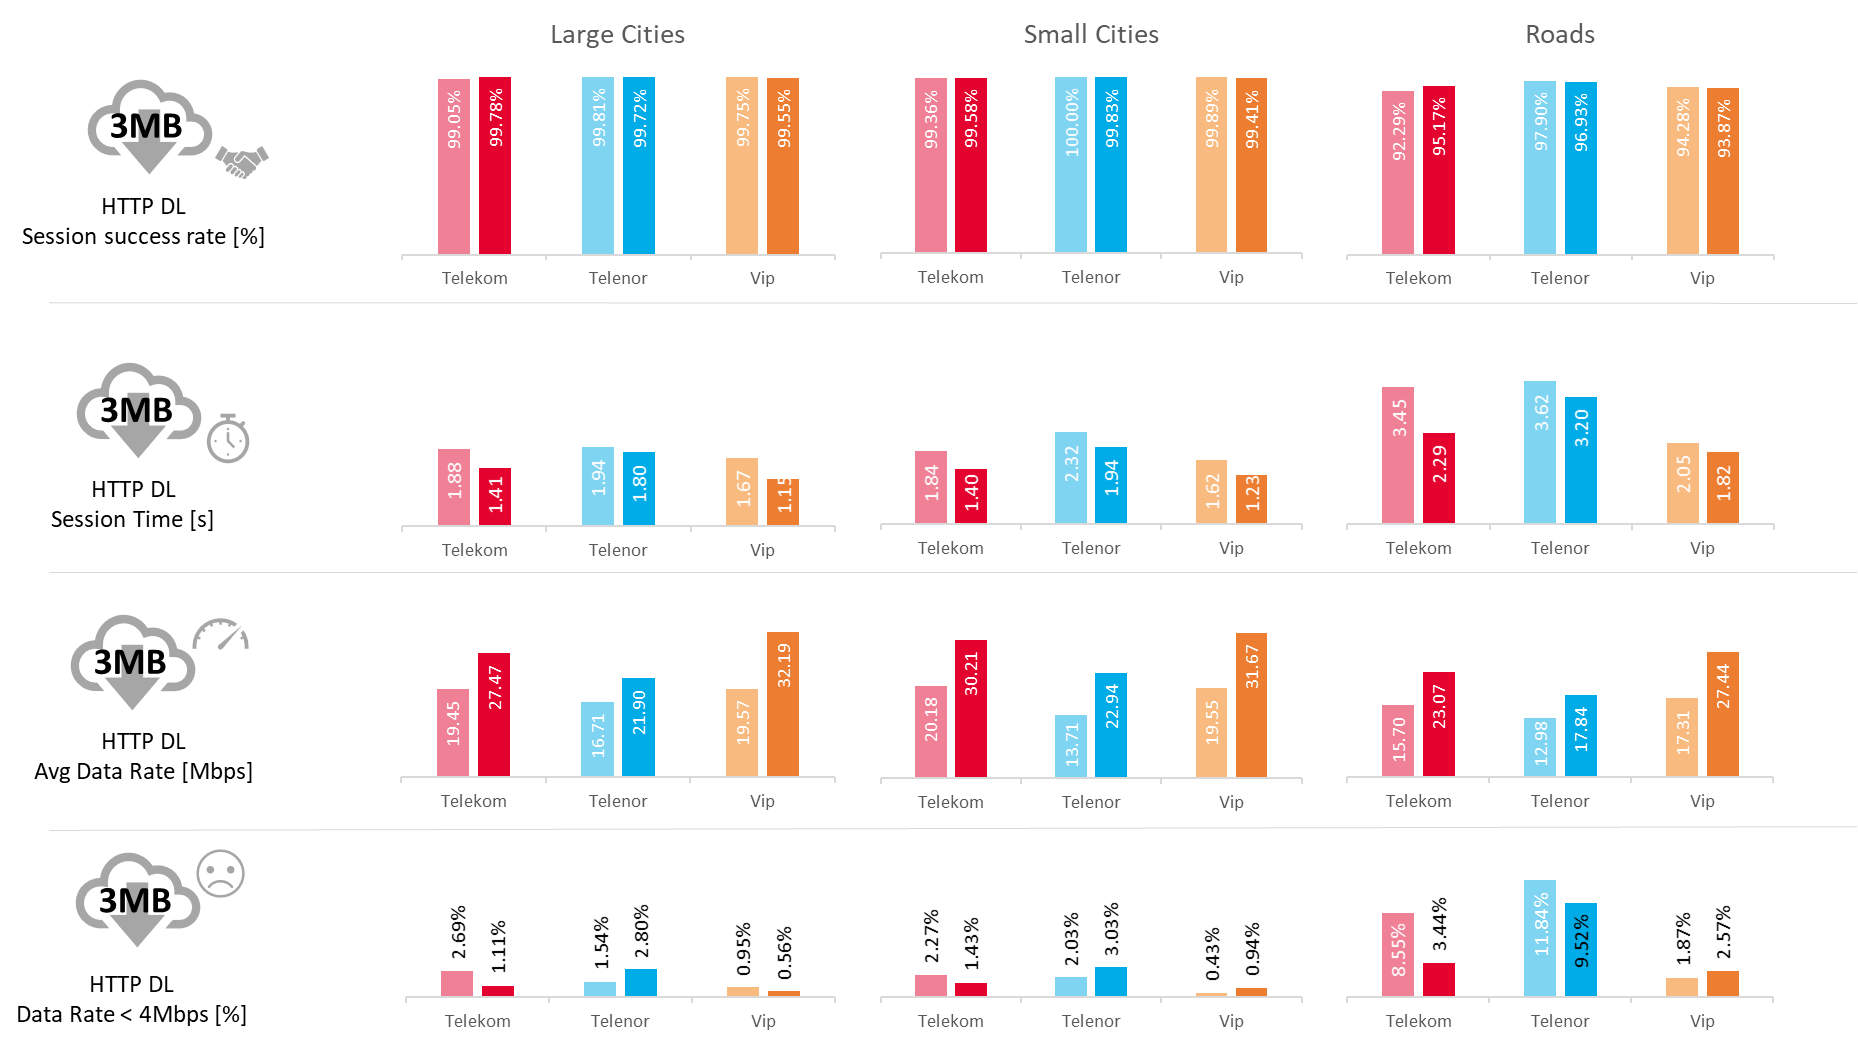
Fig. 11. Selected KPIs from HTTP Transfer DL test
Session Success Rate provides information about reliability of Internet access for mobile users. Performance of all operators has remained stable and on excellent level since 2017. Differences between operators are not likely to be recognized by users.
Session Time & Average Data Rate are complimentary metrics which should be considered together, as they give indication about network flexibility in delivering instantaneous data rates. During this data test, effectiveness of TCP proxy / acceleration mechanisms is evaluated together with radio network performance. All operators presented improved performance compared to 2017 results. While Telenor typically improved by 0.2 s – 0.4 s, Telekom Srbija and Vip mobile improved by 0.4 s – 1.15 s. Vip mobile is leading in Session Time, while Telekom Srbija is leading in Average Data Rates. This indicates that Vip mobile network showed higher efficiency of TCP layer platforms, as Session Time contains both: data transfer, as well as TCP connection establishment and closure. While downloading multiple small files, users of Vip mobile network would experience the best performance.
Percentage of Tests with Data Rate below 2 Mbps is a metric which describes portion of the network not satisfying the criteria for minimal user satisfaction for Internet connectivity. During the 2018 benchmark, Telekom Srbija had improvement in all categories, Telenor results degraded in Large & Small Cities and improved on Roads. Vip mobile improved in Large Cities but degraded in Small Cities and Roads. To sum up, Vip mobile users would have the best user perception in every category, while Telenor remained as the operator with biggest room for improvement – especially on Roads.
HTTP Transfer UL
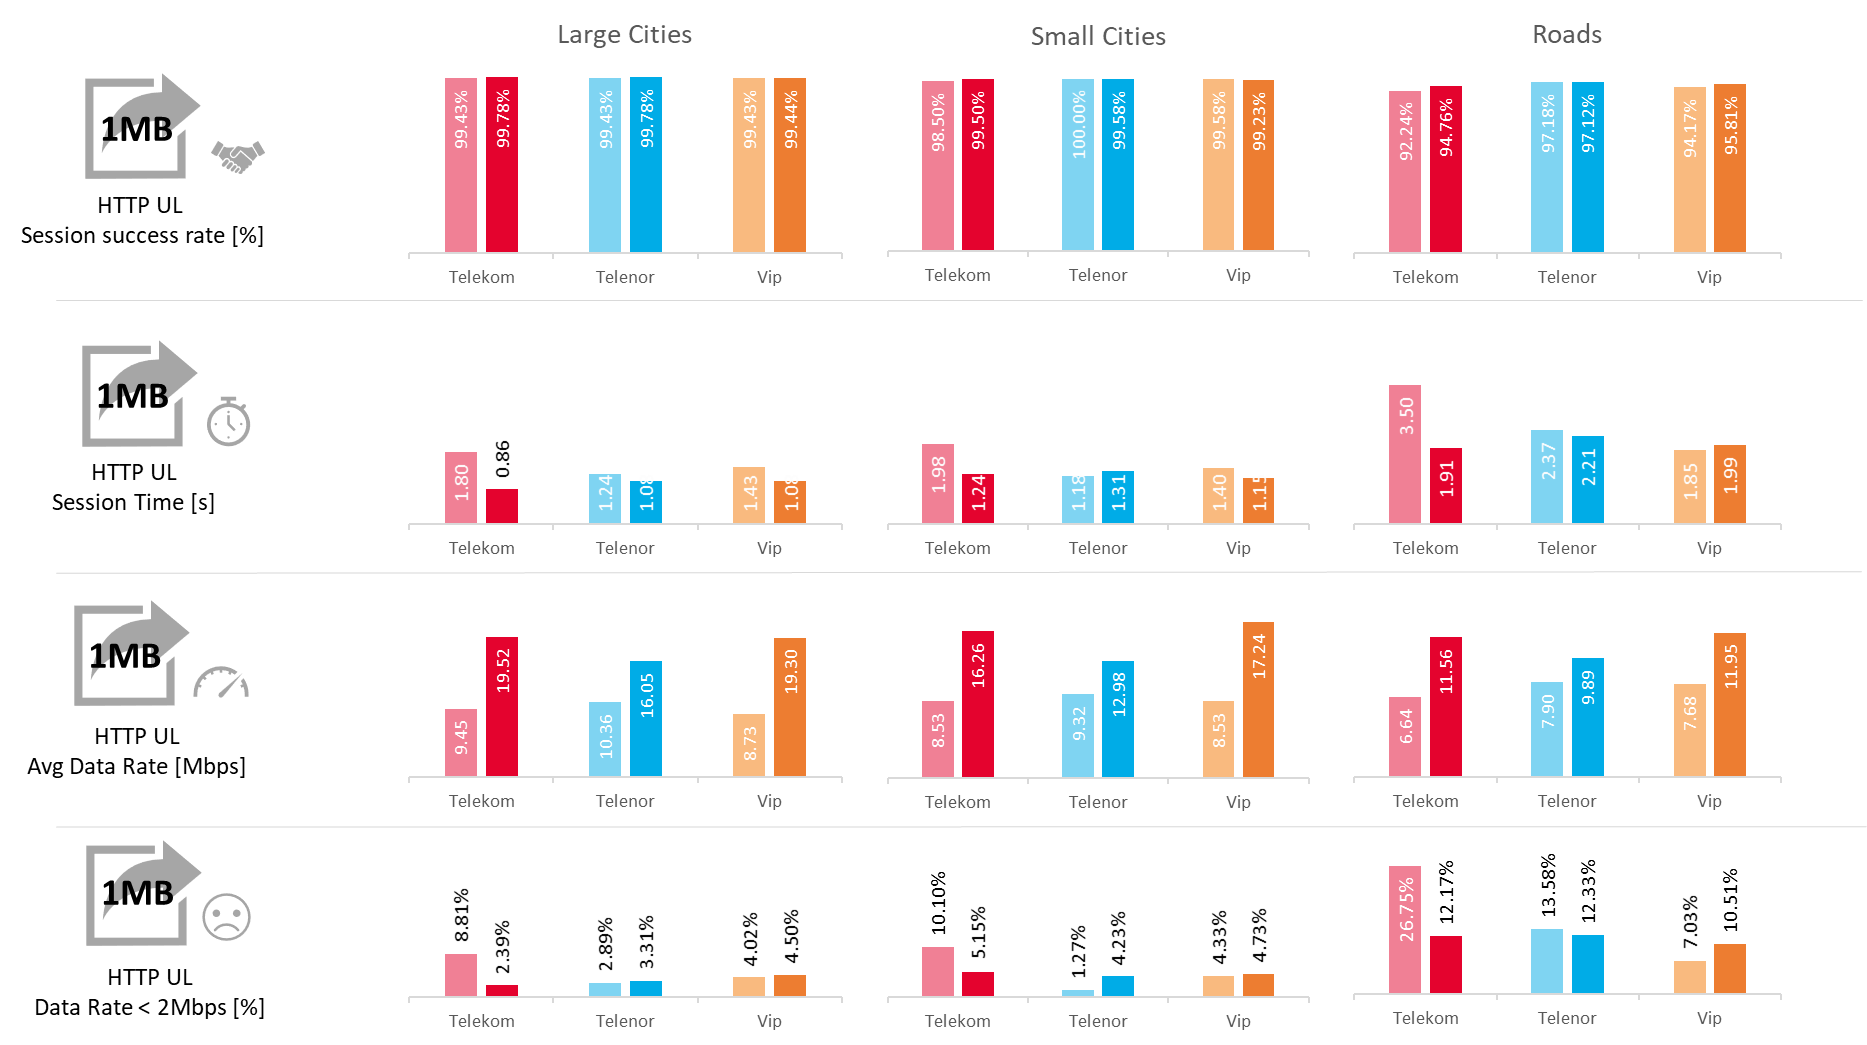
Fig. 12. Selected KPIs from HTTP Transfer UL test
Session Success Rate provides information about reliability of Internet accessfor mobile users. All operators presented stable and excellent results in Large & Small Cities. Roads remained the most challenging area for Uplink data Transfer, as terminals are constrained by transmit power limitations and distance to the base station. In this category, Telenor was ranked as the best operator, with small improvement in 2018, Vip mobile improved by 1.6 pp, but remained in second place and Telekom Srbija ranked as the last one despite the biggest improvement (2.5 pp). Success Rates on Roads confirm that limitations of Internetconnectivity remain recognizable to end users and should be improved further.
Session Time & Average Data Rate are complimentary metrics which should be considered together, as they give indication about network flexibility in delivering instantaneous data rates. During this data test, effectiveness of TCP proxy / acceleration mechanisms is evaluated together with radio network performance. All operators made improvement for those metrics, best improvement being visible in case of Telekom Srbija, who ranked the best for session time, with very small advantage over Vip mobile.
Percentage of Tests with Data Rate below 2 Mbps is a metric which describes portion of the network not satisfying the criteria for minimal user satisfaction for Internet access. While during 2017 Telenor was leading in Cities and Vip mobile on Roads, for this year’s benchmarking campaign, it was Telekom Srbija who was leading in the Large Cities category and Telenor leading in Small Cities and Roads. Overall differences between operators have diminished during the 2018 benchmark. For Roads, above 10% of the area is not satisfying the 2 Mbps throughput threshold, which will have an impact on user-perceived quality of the service. The small files upload becomes prolonged (i.e. upload of photos to social networks) and possibilities of making video calls would be limited.
Browsing
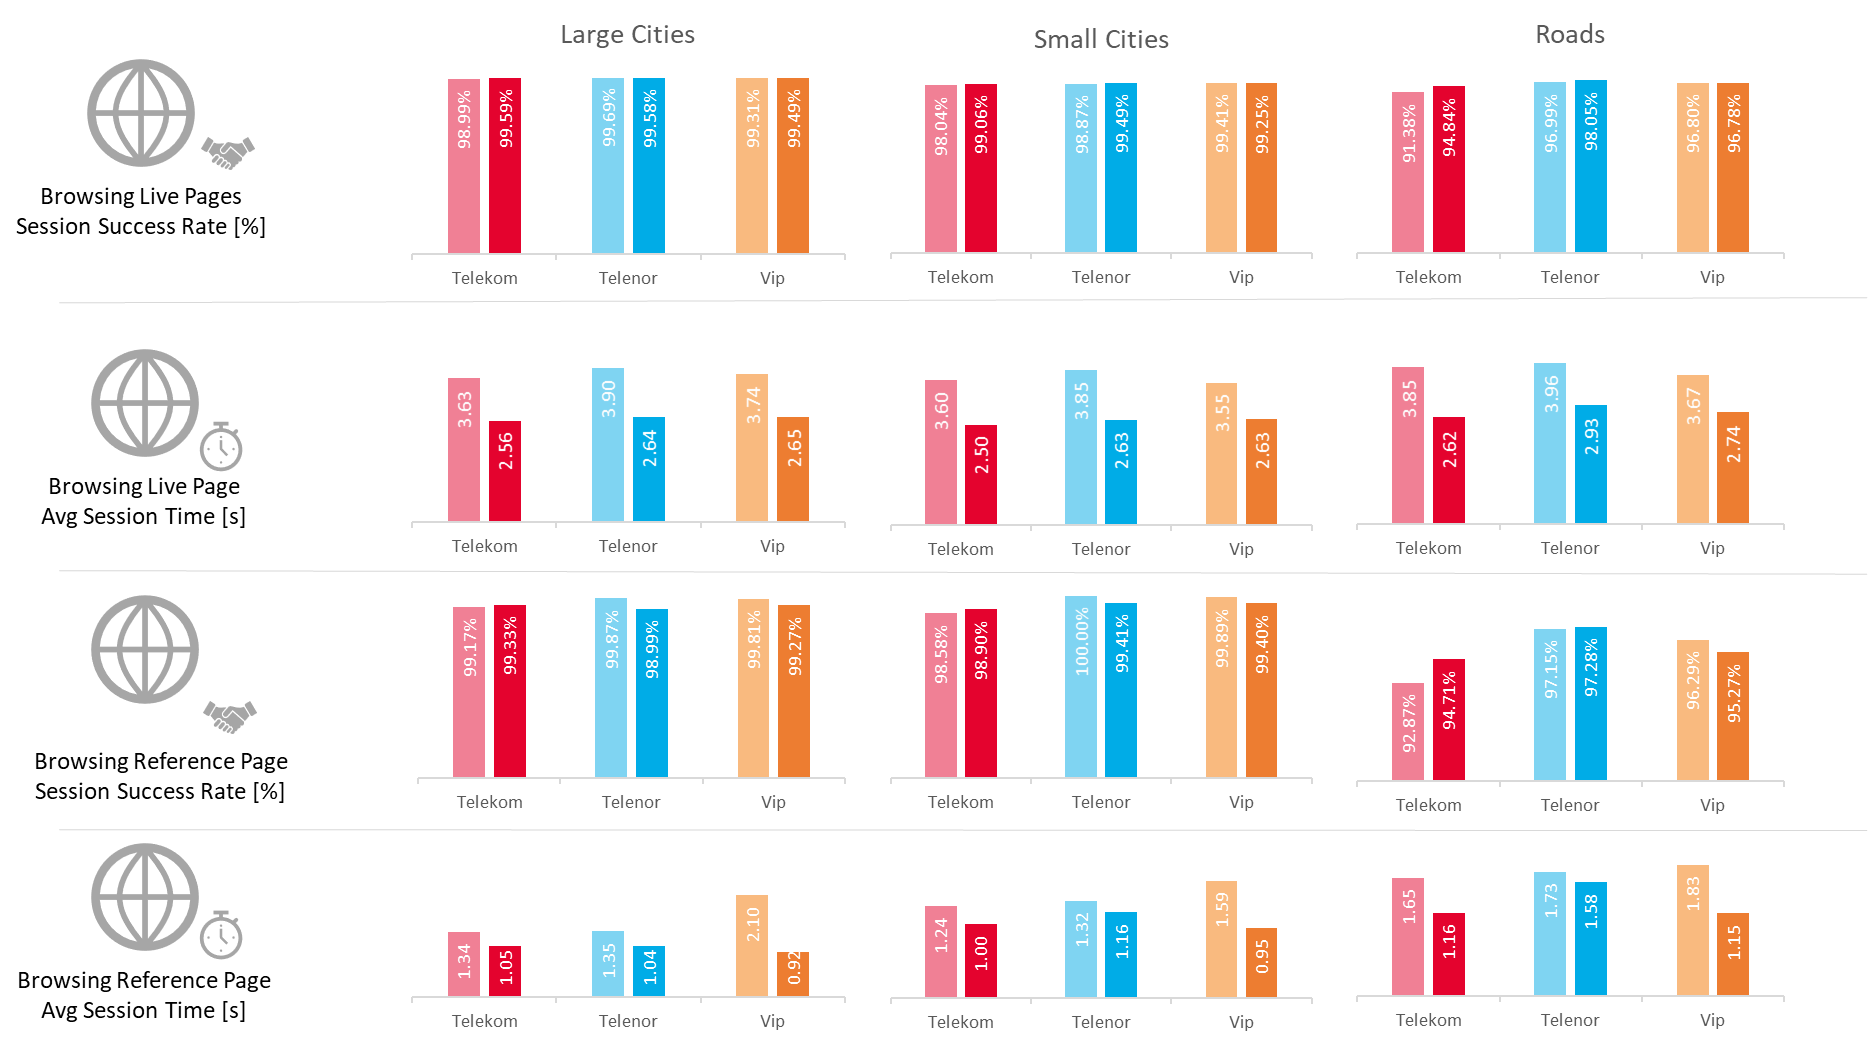
Fig. 13. Selected KPIs from Browsing tests
Live Page Session Success Rate presents the closest reflection of real life user perception of web browsing. During the 2018 benchmark, all operators showed almost identical performance in Large & Small Cities, with differences not recognizable to end user. On Roads, results differentiated, with Telenor ranking as the best, Vip mobile the second and Telekom Srbija third. While differences on Roads do not seem large, they would be recognizable by end users. Differences between 2017 and 2018 results can be attributed not only to the operators’ network performance, but also to the changes of live pages content and structure.
Live Page Average Session Time differs between campaigns due to operators’ network improvement, as well as live page content and structure – similarly to Session Success Rate. All operators presented very similar performance, with Telekom Srbija being slightly better at every aggregation.
Reference Page Success Rate results for this year’s benchmark improved in case of Telekom Srbija and degraded for Telenor and Vip mobile. Differences in performance for Large and Small Cities are not likely to be recognized by the end users. On Roads, Telekom Srbija and Vip mobile users may note decreased performance compared to Telenor users.
Reference Page Session Time results were improved by all operators. The biggest improvement was made by Vip mobile (1.2 s for Large Cities, 0.64 s for Small Cities and 0.68 s on Roads). Differences between operators in Cities are unlikely to be recognized by users. On Roads, difference became significant, as Telenor users may recognize degraded session time compared to competitors.
YouTube
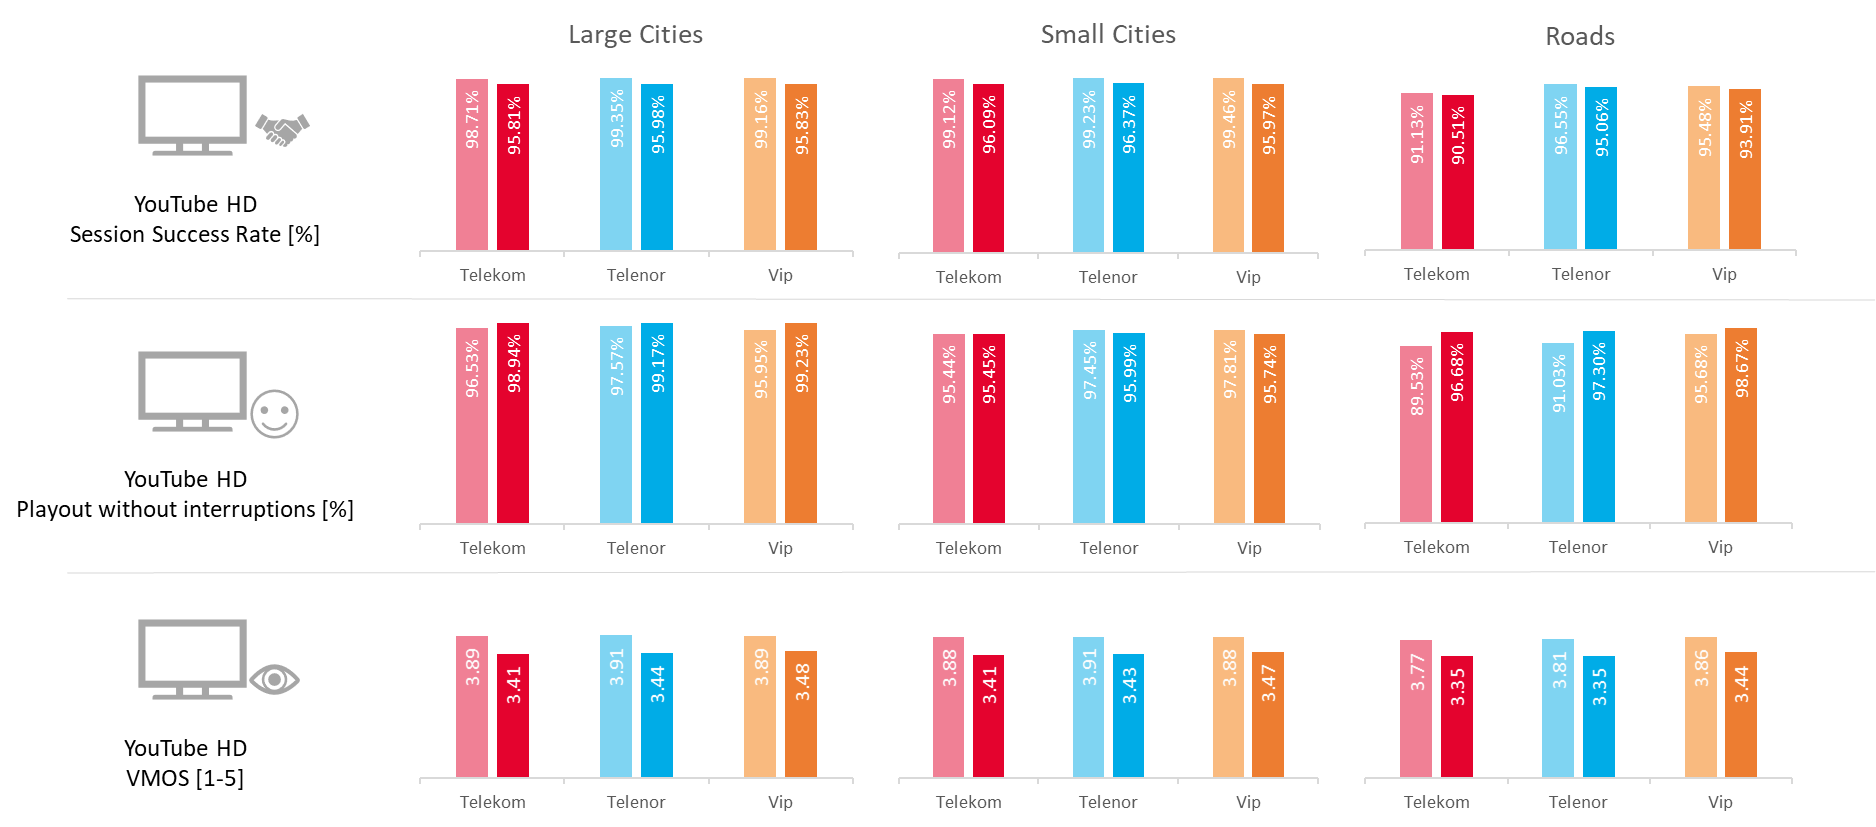
Fig. 14. Selected KPIs from YouTube tests
YouTube Session Success Rate decreased in Large & Small Cities by around 3 pp for all operators. Differences between operators in those categories are not recognizable by the end users. On Roads, results remained stable between the campaigns, with Telenor having advantage over competitors. In this category, differences between operators are recognizable by the end user.
YouTube Playout without Interruptions was improved by all operators during the 2018 measurements. In Large Cities, Vip mobile made the biggest improvement of 3.28 pp, taking the first position, just ahead of Telenor. In Small Cities, Telekom Srbija remained on the same level, while Telenor and Vip mobile degraded slightly – all operators having almost identical performance as a consequence. On Roads, Telekom Srbija made the biggest improvement of 7.15 pp, Telenor improved by 6.03 pp and Vip mobile by 3pp. Vip mobile remained the best ranked operator, with only small advantage over competitors.
YouTube VMOS is a complex metric which reflects all aspects of video quality (Resolution, Interruptions, Blurriness, Blockage, etc.). Comparing the results between 2017 and 2018, a degradation of 0.4 VMOS points for all operators can be observed. This is caused by different YouTube player behaviour. Measurements in 2017 were performed with YouTube App v11.49.55, which starts playout aggressively from 1080p resolution. With a new version of application, YouTube modified the application behaviour. During the 2018 benchmark, YouTube App v13.10.55 was used. This app starts conservatively with low resolution and upgrades gradually over time to 1080p. Comparing the results between operators, Vip mobile scored consistently higher 0.04 – 0.09 VMOS points. Such small difference is unlikely to be recognized by the end user.
Radio Coverage
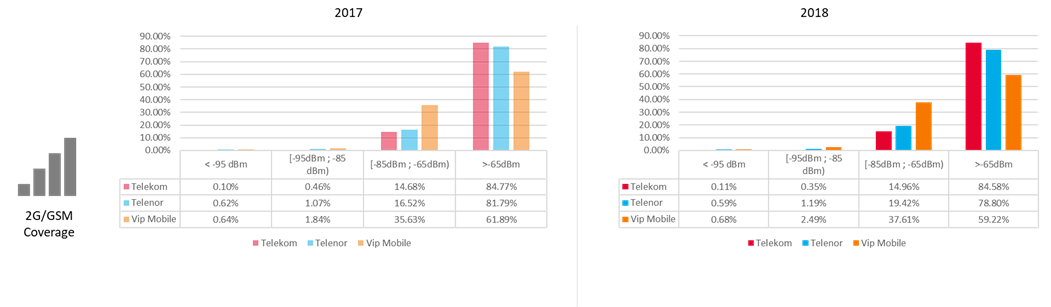
For GSM technology, the only difference is a very small degradation in coverage for Telenor and Vip mobile (2-3% of samples from excellent to good). Telekom Srbija is still in the lead.
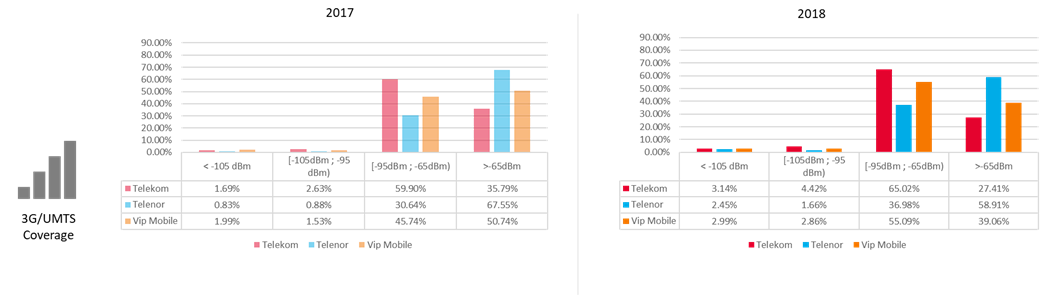
For UMTS technology, a ~10% shift from an excellent to a good category can be observed for all operators. Despite this, the coverage is very good for all the networks, with Telenor still being in the lead.
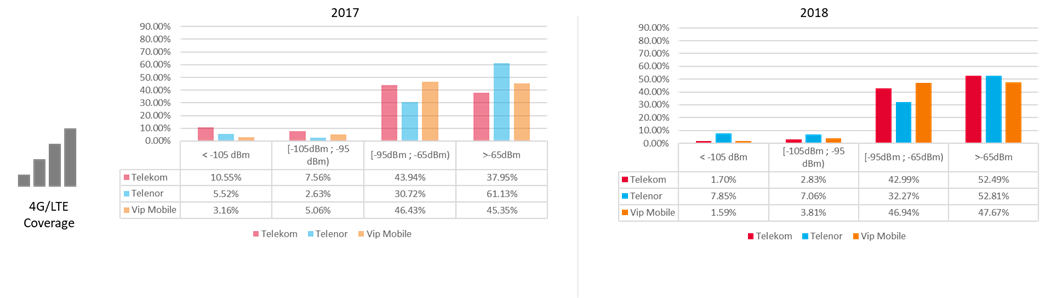
Telekom Srbija has less samples in the two worst coverage categories, which moved to the “excellent” grouping (over 15%). Telenor has less samples in the excellent coverage category (a 10% decrease), with an increase in the good and poor groupings. Vip mobile coverage has improved very slightly, with 2% more samples in the excellent category.