The selected KPIs for data tests achieved by operators with the split per aggregation type are presented in Figure 1. Those show differences between operators for browsing, data transfer and YouTube video watching.
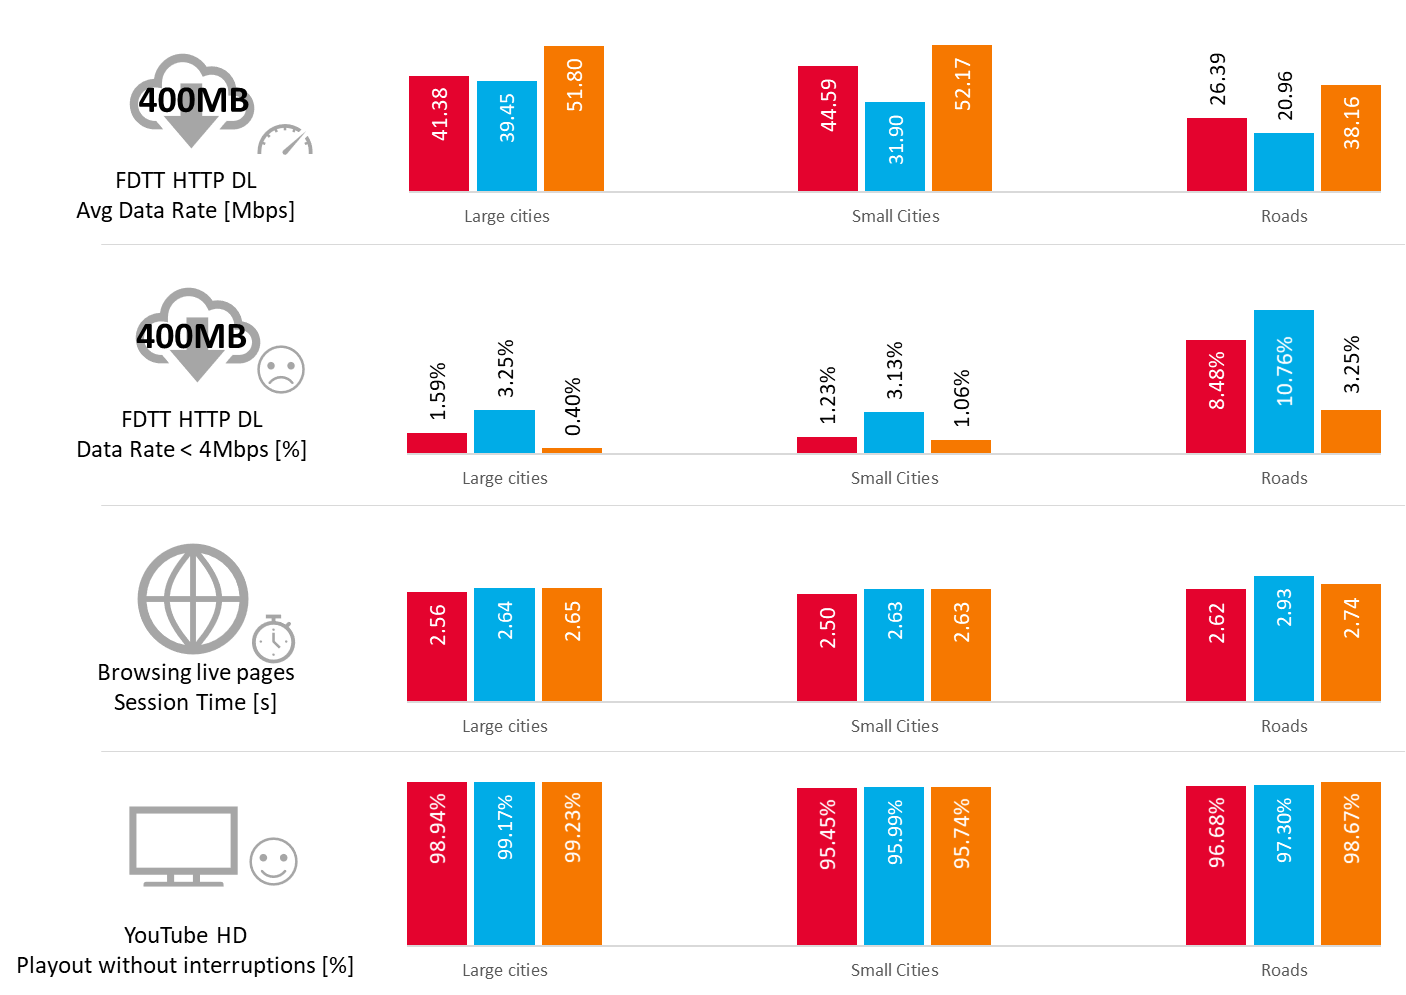
Fig. 1. Selected KPI from data test
Results for FDTT HTTP DL (400 MB file transmission) tests are presented in Figure 2.
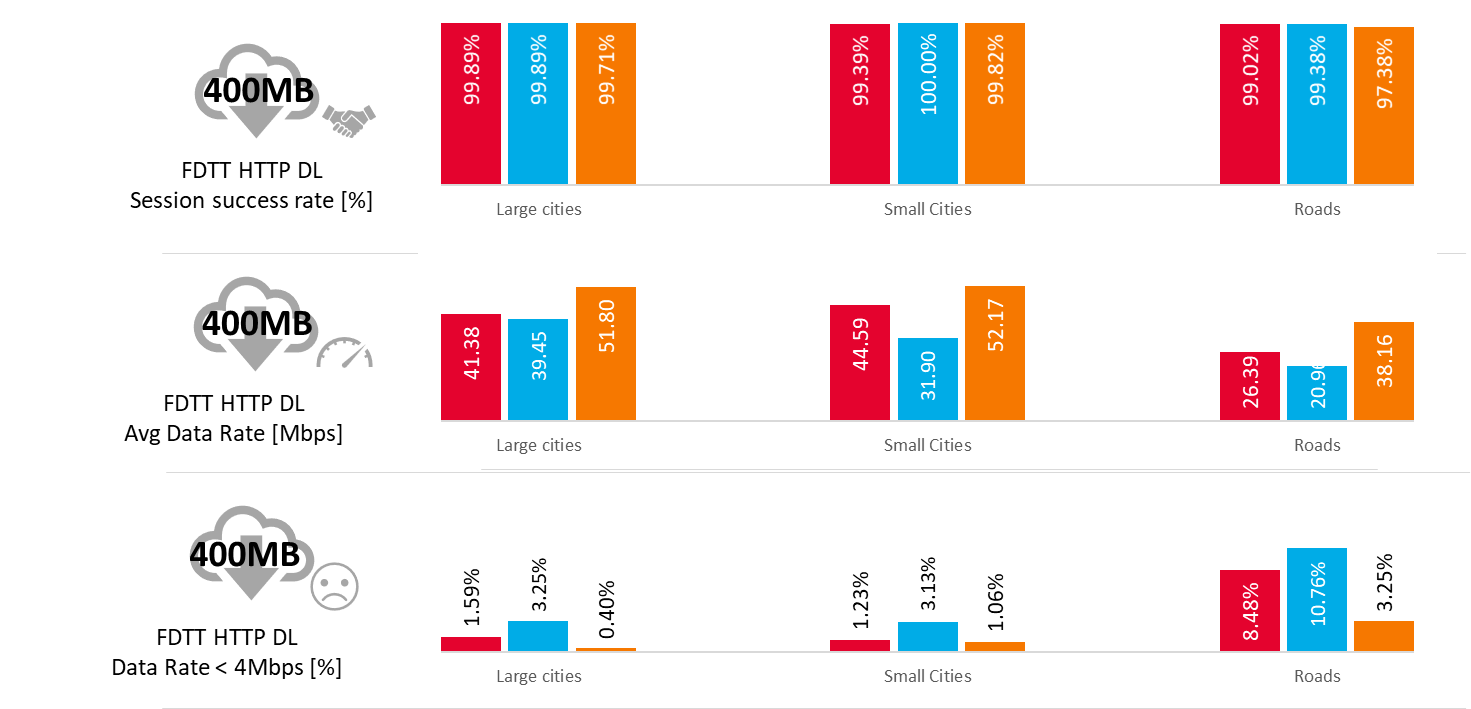
Fig. 2. KPIs results for FDTT HTTP Capacity Transfer - Download (FDTT HTTP DL)
Large Cities:
All operators had near perfect session success rates. Vip mobile had a much higher average data rate, with 10 Mbps lead over the other two operators. All three mobile operators had a low share of samples with data rate below 4 Mbps. All three operators achieved high data rates due to the Carrier Aggregation (CA) usage. Vip mobile achieved the best result, despite Telenor having the highest CA usage. The Telekom Srbija network had a similar data rate performance as Telenor, even though Telekom Srbija had the lowest CA usage amongst all operators.
Small Cities:
In Small Cities, the success rate was nearly the same for all competitors. Carrier Aggregation (CA) usage was much smaller compared to Large Cities, with only Telenor and Vip mobile having some availability of CA. Vip mobile achieved the highest data rates, Telekom Srbija came second in the ranking and Telenor third.
Roads:
Telenor took the lead in terms of success rate, with Telekom Srbija following closely and Vip mobile remaining behind by 1.6 percent. In terms of data rate, Vip mobile had an advantage over competitors. 4G roll-out on Roads was significantly lower compared to the other aggregations, except for Vip mobile which had around 90% of LTE usage. Telenor and Telekom Srbija stayed behind with an average data rate lower by over 10 Mbps and higher share of samples below the 4 Mbps threshold. Vip mobile was the only operator with Carrier Aggregation on Roads.
Large Cities
Results for FDTT HTTP DL throughputs in Large Cities are shown in Figure 3. They show the average and maximum network capabilities in delivering the highest continuous throughput. Vip mobile achieved the highest average data rate, followed by Telekom Srbija and Telenor.
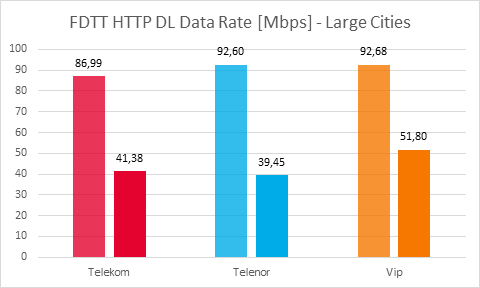
Fig. 3. FDTT HTTP DL throughputs in Large Cities
Small Cities
Results for FDTT HTTP DL throughputs in Small Cities are presented in Figure 4. Vip mobile took the clear lead in delivering the highest average and maximum throughputs in Small Cities.
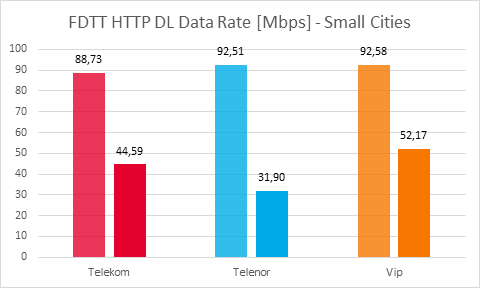
Fig. 4. FDTT HTTP DL throughputs in Small Cities
Roads
Results for FDTT HTTP DL throughputs on Roads are presented in Figure 20. Again, Vip mobile had the highest average and maximum throughput results. The competition was much further behind with Telekom Srbija second and Telenor third.
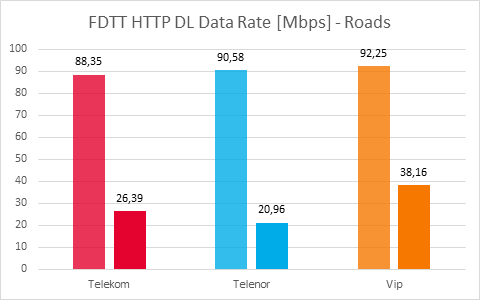
Fig. 5. FDTT HTTP DL throughputs on Roads
Results for FDTT HTTP UL (400 MB file transmission) tests are presented in Figure 6.
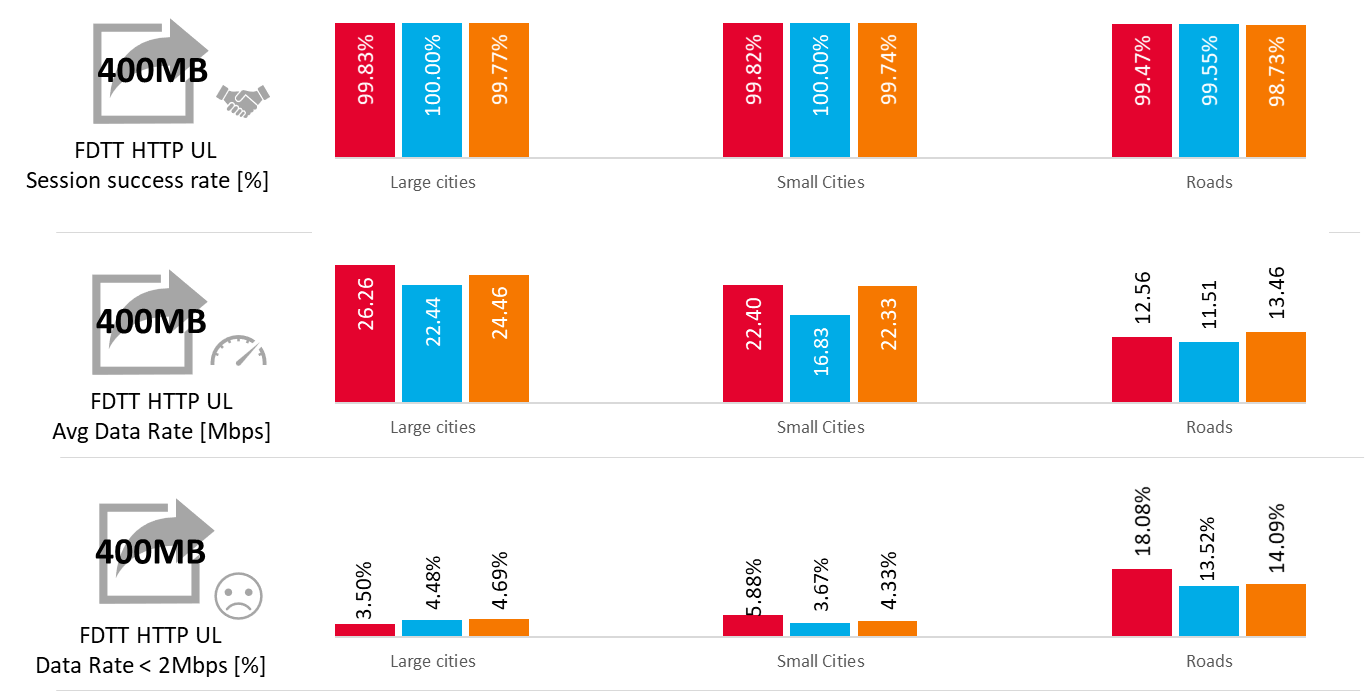
Fig. 6. KPIs results for FDTT HTTP Capacity Transfer – Upload (FDTT HTTP UL)
Large Cities:
All operators had near perfect overall success rates and very high 4G usage. Telekom Srbija had the best average data rate, with Vip mobile close second and Telenor third. All three operators had a low percentage of samples, below 2 Mbps.
Small Cities:
The success rate in Small Cities was still on a near perfect level. The average data rate values dropped, Telekom Srbija and Vip mobile have nearly even results. Telekom Srbija has a slightly higher number of samples with very low throughput, but still on a good level.
Roads:
The success rate for all operators was marginally worse compared to Cities, but still on a very good level. Vip mobile was slightly behind the competition. The average data rate is much lower than in Cities, the results are comparable between operators. Telekom Srbija has the most samples with low throughput (over 18%), Telenor and Vip mobile have about 5% less.
Results for HTTP DL 3 MB tests are presented in Figure 7.
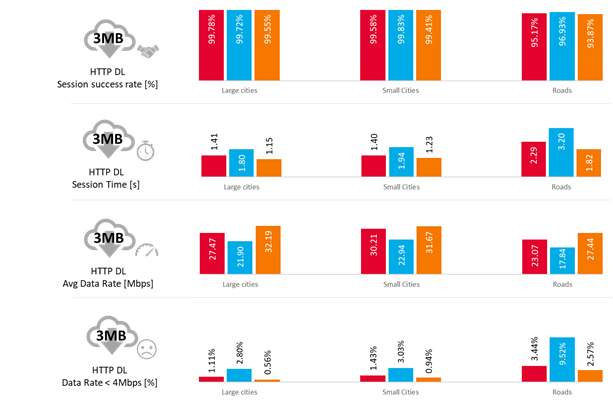
Fig. 7. KPIs results for HTTP File Transfer - Download (HTTP DL 3 MB)
Large Cities:
All operators achieved excellent session success rates. Vip mobile had the shortest average session time. The good result of Vip mobile was caused by higher LTE utilization and smallest percentage of samples with low data rates. Telekom Srbija had higher average data rates than Telenor, and less samples with a data rate less than 4 Mbps. Telenor had more samples with low throughput comparing to the competition.
Small Cities:
Similarly to Large Cities, VIP mobile had the best overall results, with Telekom Srbija being second and Telenor third. Despite having a perfect, 100% success rate, Telenor had the lowest data rate and the longest average session time. Telekom Srbija had the highest number of samples with data rates less than 4 Mbps.
Roads:
As expected, session success rates on Roads were lower compared to Cities. Overall, Vip mobile had the best result with the shortest session time and a good success rate. Telekom Srbija scored second in all KPIs. Telenor had very a good success rate, but an average low data rate, resulting in long session times.
Results for HTTP UL 1 MB tests are shown in Figure 8.
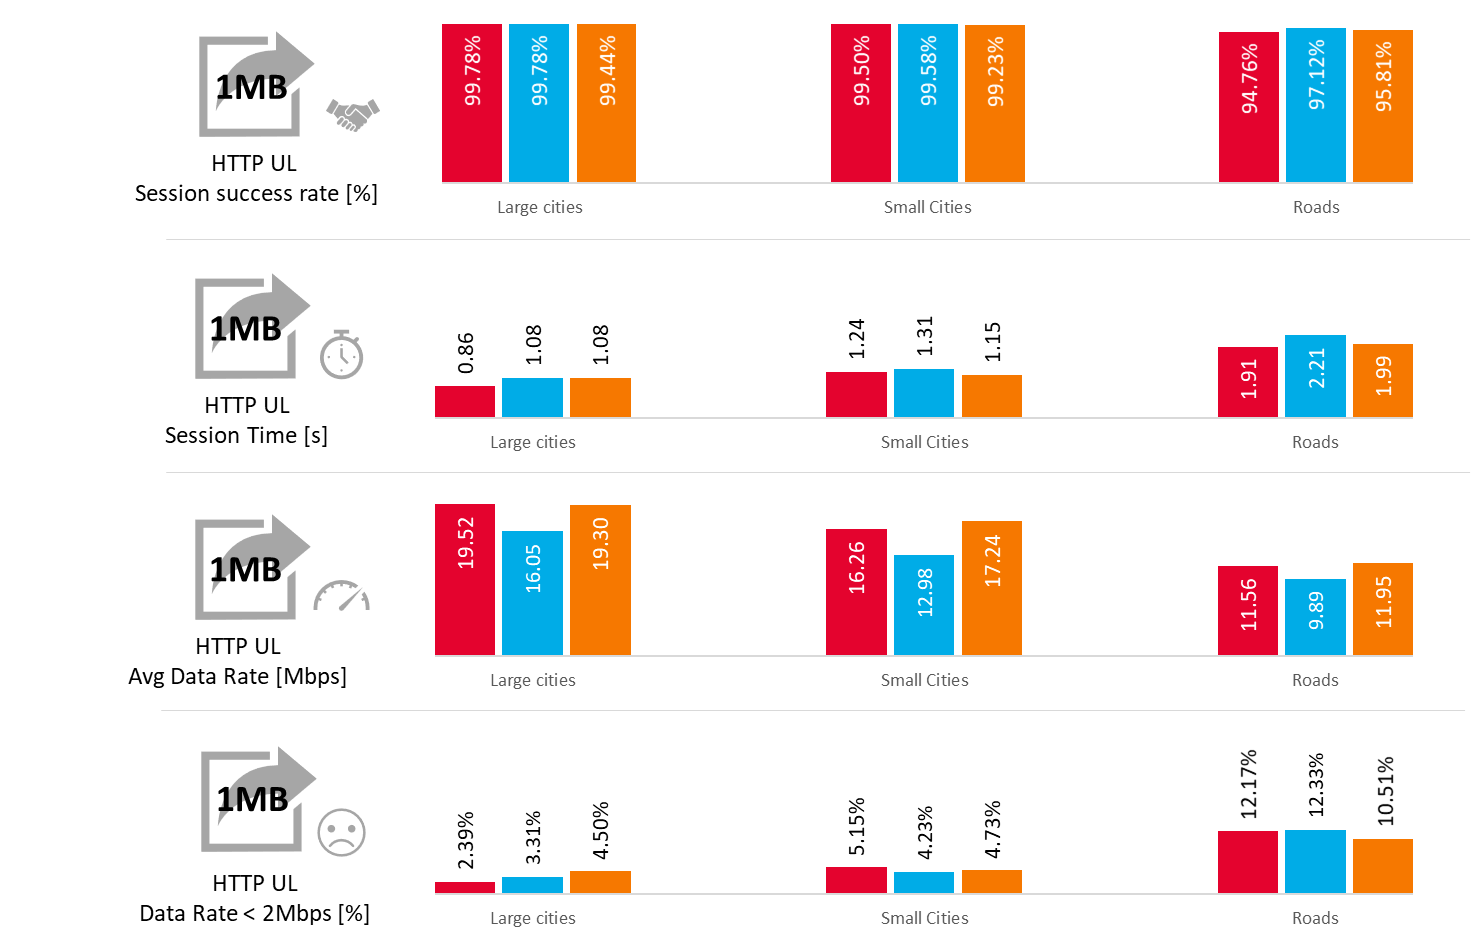
Fig. 8. KPIs results for HTTP File Transfer - Upload (HTTP UL 1MB)
Large Cities:
All mobile operators had very good session success rates, achieving very similar results. Telekom Srbija had the best data rate and average session time, due to the very high 4G usage. Vip mobile was second in throughput, but due to large number of low data rate samples tied even with Telenor in session time
Small Cities:
In Small Cities, all operators had very good success rates. Vip mobile had the best data rates and shortest session duration, Telekom Srbija was second and Telenor third. All operators had a similar number of tests with low throughput – about 5%.
Roads:
As expected, the success rates on Roads were lower compared to Cities. Telenor was leading in success rates, but Telekom Srbija took the lead in session time with Vip mobile close behind. Both Telenor and Telekom Srbija had over 12% of samples with low data rates; Vip mobile had only 10.5%.
Tests results for HTTP Browsing tests are presented in Figure 9.
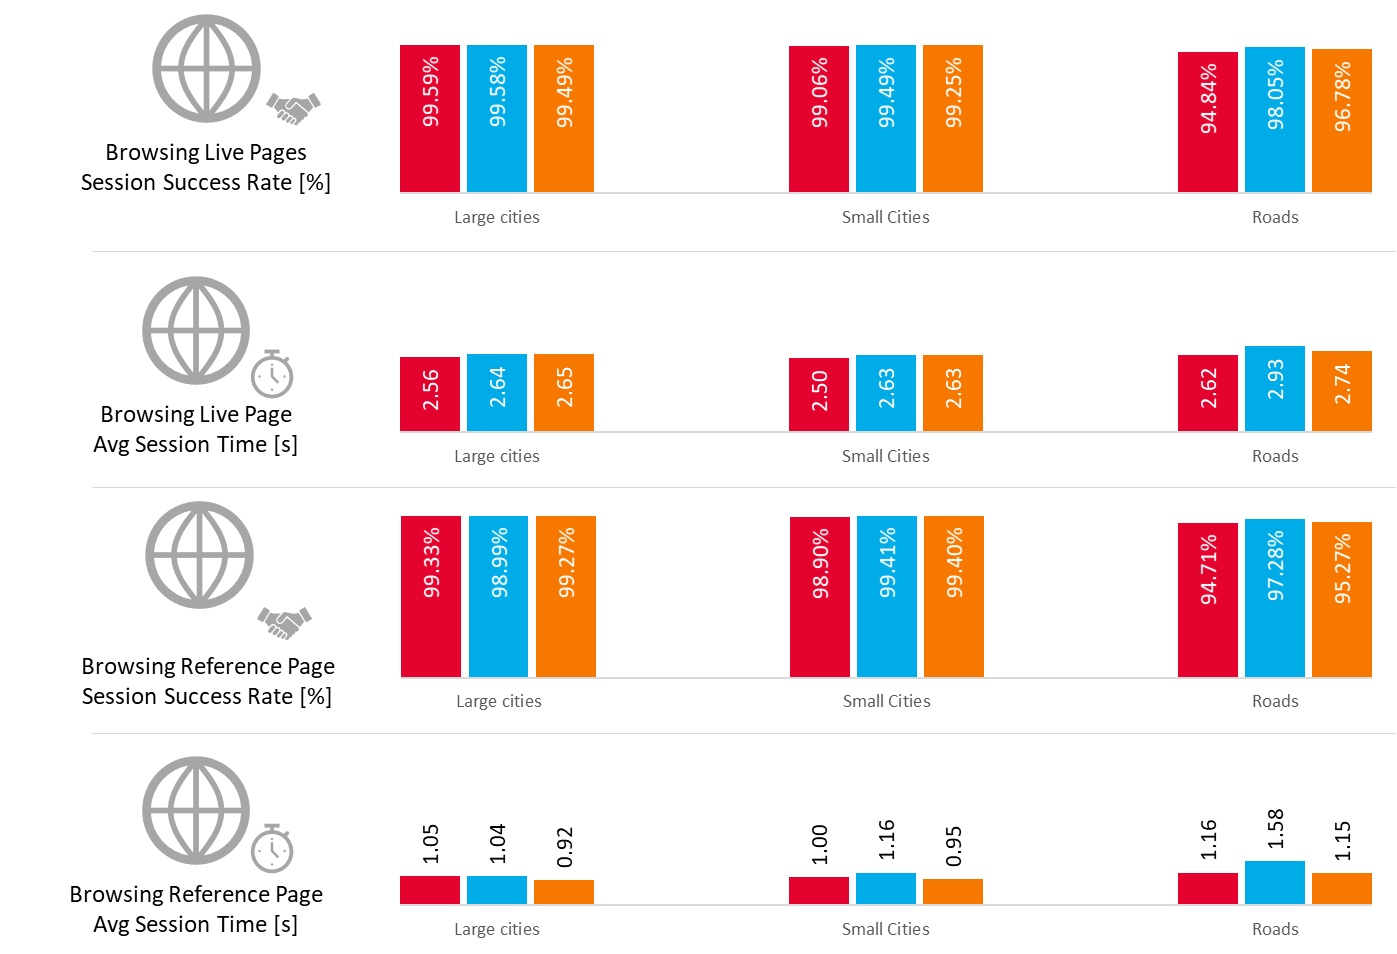
Fig. 9. KPIs results for HTTP Browsing tests
Large Cities:
Success rates for both live and reference web pages were on a very good level for all three operators, and all had a very high 4G utilization resulting in low session times. Telekom Srbija had the best session time in live pages but was last in reference website tests. The differences for all operators were very small.
Small Cities:
In Small Cities, similarly to large cites the success rates were very good. Vip mobile had the shortest session time for the reference page but was tied for second place with Telenor in live pages.
Roads:
Success rates were much lower on the Roads compared to Cities. Telenor and Telekom Srbija had a large 3G usage, while Vip mobile retained its result with over 90% of samples in 4G. Telenor was ahead of the competition in success rates but had the longest session durations.
YouTube video quality tests were performed according to ITU Recommendation J.343.1, which is relevant for the assessment of quality at the user end. The model measures the visual effect of spatial and temporal degradations as a result of video coding, erroneous transmission or video rescaling. The J.341.1 model is a no reference method, which allows assessing the quality of any content, even from unknown sources. The live streaming content was used to observe and measure quality of the video with real time data transmission to avoid buffering of whole clip and playing it from memory. As a result, the model provides a subjective assessment of visual quality on the 1 to 5 mean opinion score scale for video (VMOS).
YouTube test results of testing the quality of live stream video transmission are presented in Figure 10.
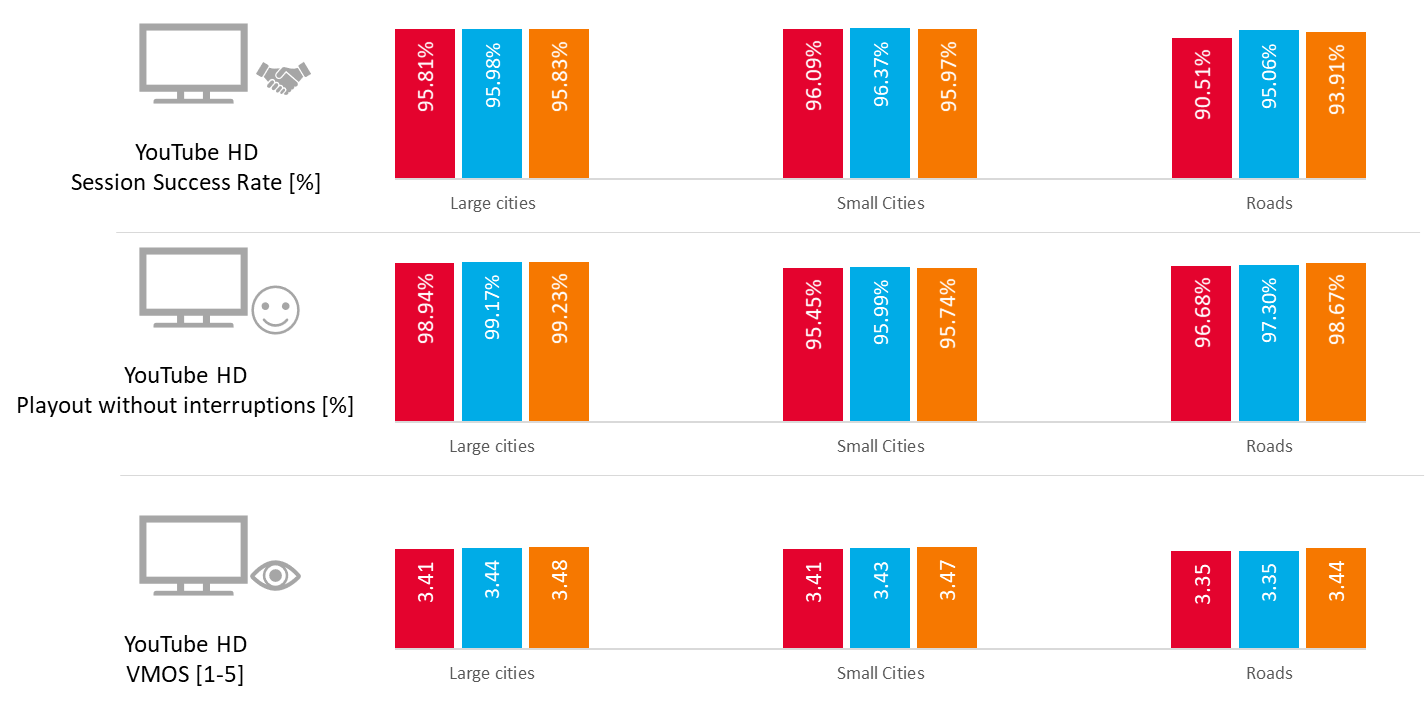
Fig. 10. KPIs results for YouTube video tests
Large Cities:
All operators had very similar results in success rates and the number of playouts without interruptions. Telekom Srbija had the worst average video quality, Telenor was second and Vip mobile was the best.
Small Cities:
All three operators had very good success rates, but a visible degradation in number of playouts without interruptions compared to Large Cites is visible. Similarly, to Large Cities Vip mobile had the highest average video quality, Telenor was second and Telekom Srbija third.
Roads:
Telekom Srbija was behind the competition in success rates. Playout rates degraded mostly for Telekom Srbija and Telenor, while Vip mobile retained a good 98.7% level of video playouts without interruption. Telekom Srbija and Telenor VMOS degraded in comparison to the Cities results, mainly due to lower 4G usage. Vip mobile was clearly the best with over 87% of video samples in full HD and VMOS result of 3.44.
Ping test results are presented in Figure 11.
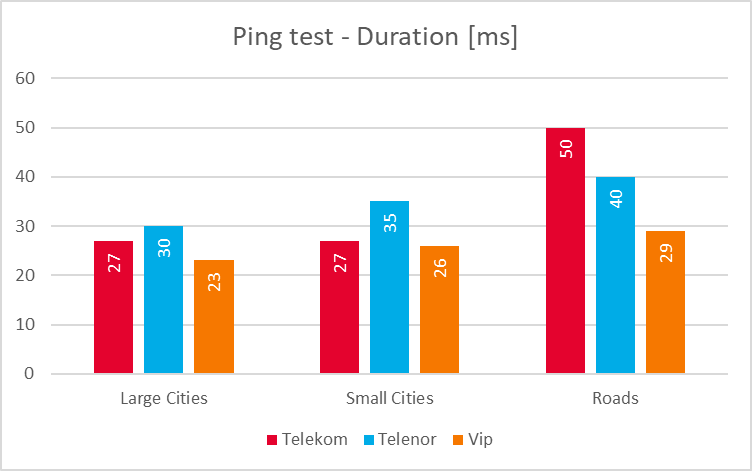
Fig. 11. Ping test – Duration
Large Cities:
Average latency was on a very good level for all three operators below 30 milliseconds, which is a value typical for 4G networks. Vip mobile had the best results, while Telekom Srbija and Telenor were further behind.
Small Cities:
Average latency was still on a very good level for all three operators. Compared to Large Cities, the latency increased a bit for Vip mobile and Telekom Telenor Srbija.
Roads:
On Roads, the average ping duration degraded significantly for Telekom Srbija, to a value of 50 ms, which is closer to the average latency expected for 3G. Telenor increased to 40 ms and Vip mobile stayed below 30 ms.