In assessing the overall performance and overall score of each mobile network, 4 main categories of services have been evaluated:
With this methodology applied, Telenor achieved 63.14 (out of 100) scoring points, followed by Vip mobile with 61.40 (out of 100) scoring points and Telekom Srbija with 59.58 (out of 100) scoring points.
Telenor achieved the highest overall score due to the best quality of services in all three measurement aggregations, in Large Cities, Small Cities and on Roads. In Small Cities and on Roads, the results of Telenor and Vip mobile are similar, but with Telenor being slightly ahead. The difference between these two mobile operators in scoring results is minimal. Thus, it can be perceived that both operators are having similar overall quality, but being different in specific categories and places.
The mobile Network Benchmarking results achieved in 4 main categories of services and on every measurement aggregation (Large Cities, Small Cities, Roads), as well as the overall scores achieved, are presented in Figure 1 below. Values for aggregations on the right are weighted values as used for the calculation of the final score.
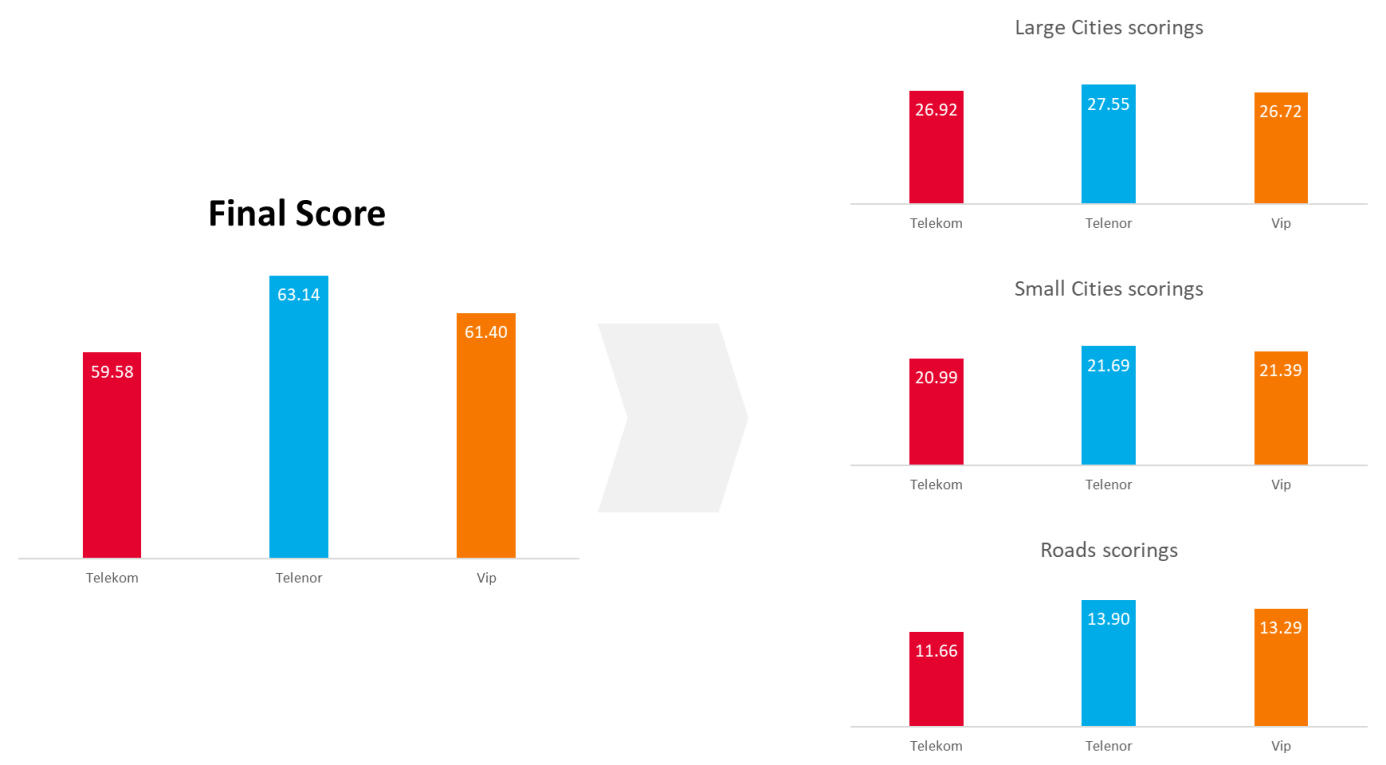
Fig.1. Final and Aggregation scorings for all three operators
The Voice services scores achieved are presented in Figure 2 below.
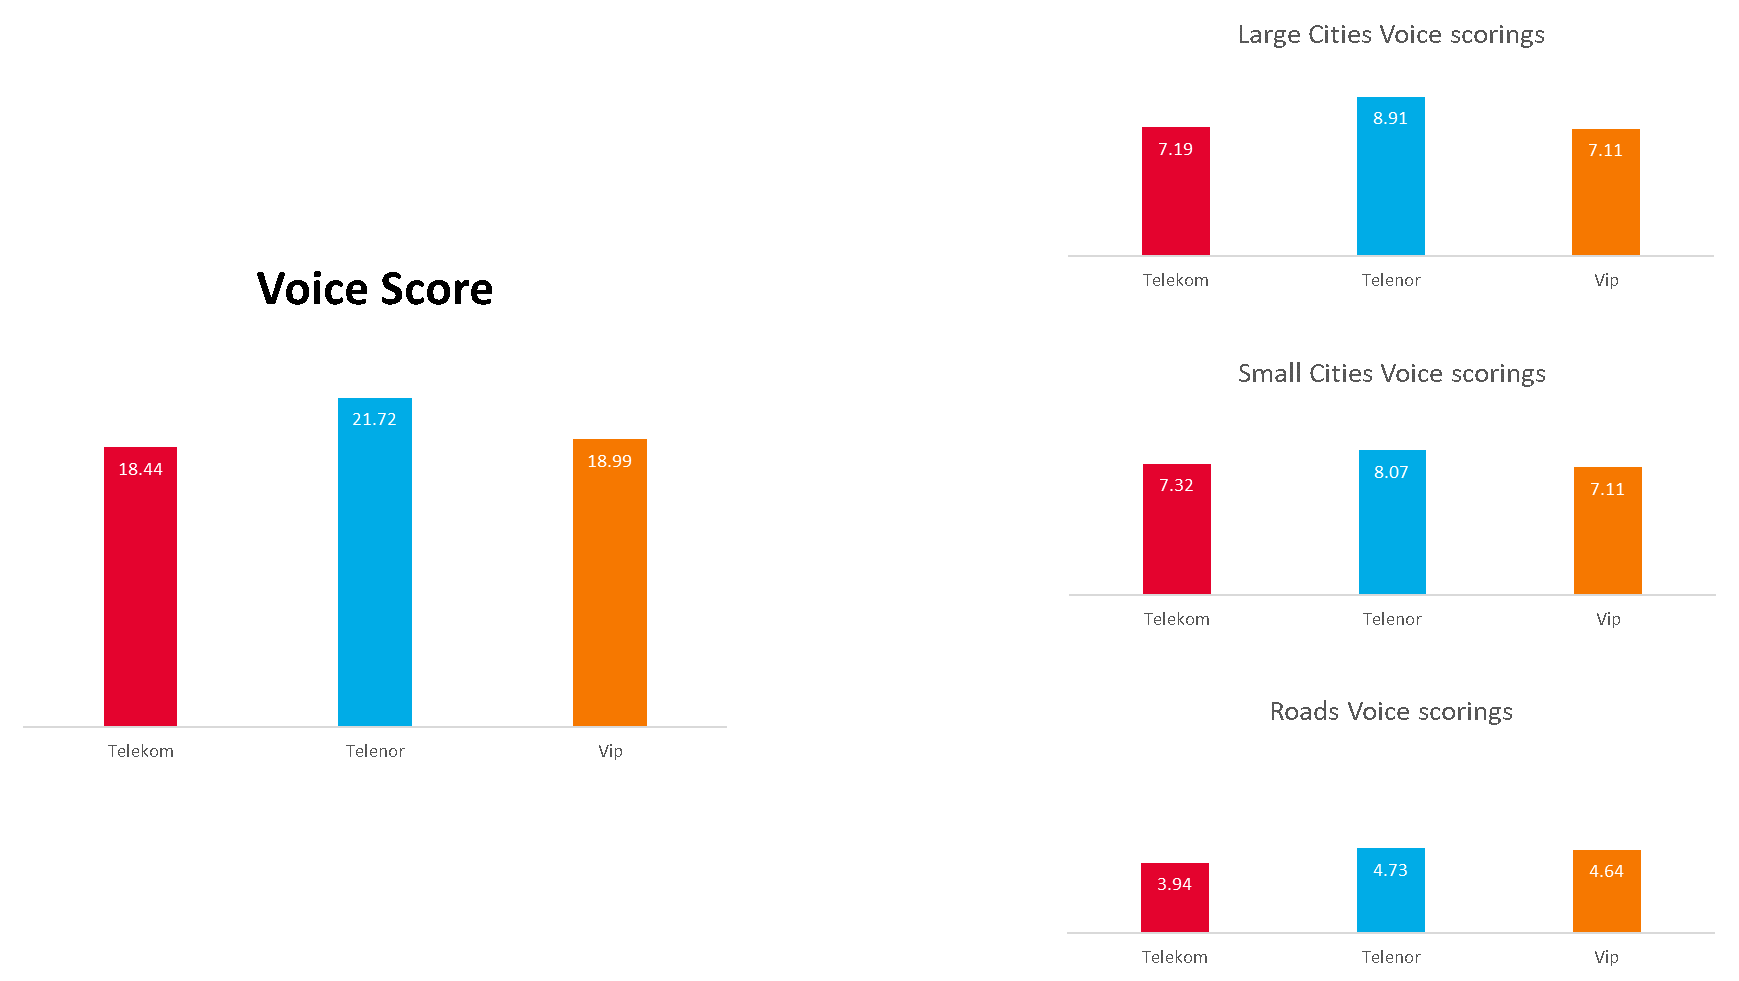
Fig.2. Final and Aggregation Voice scorings for all three operators
Scores for data tests including data transmission, web browsing and YouTube are presented on Figure 3 below.
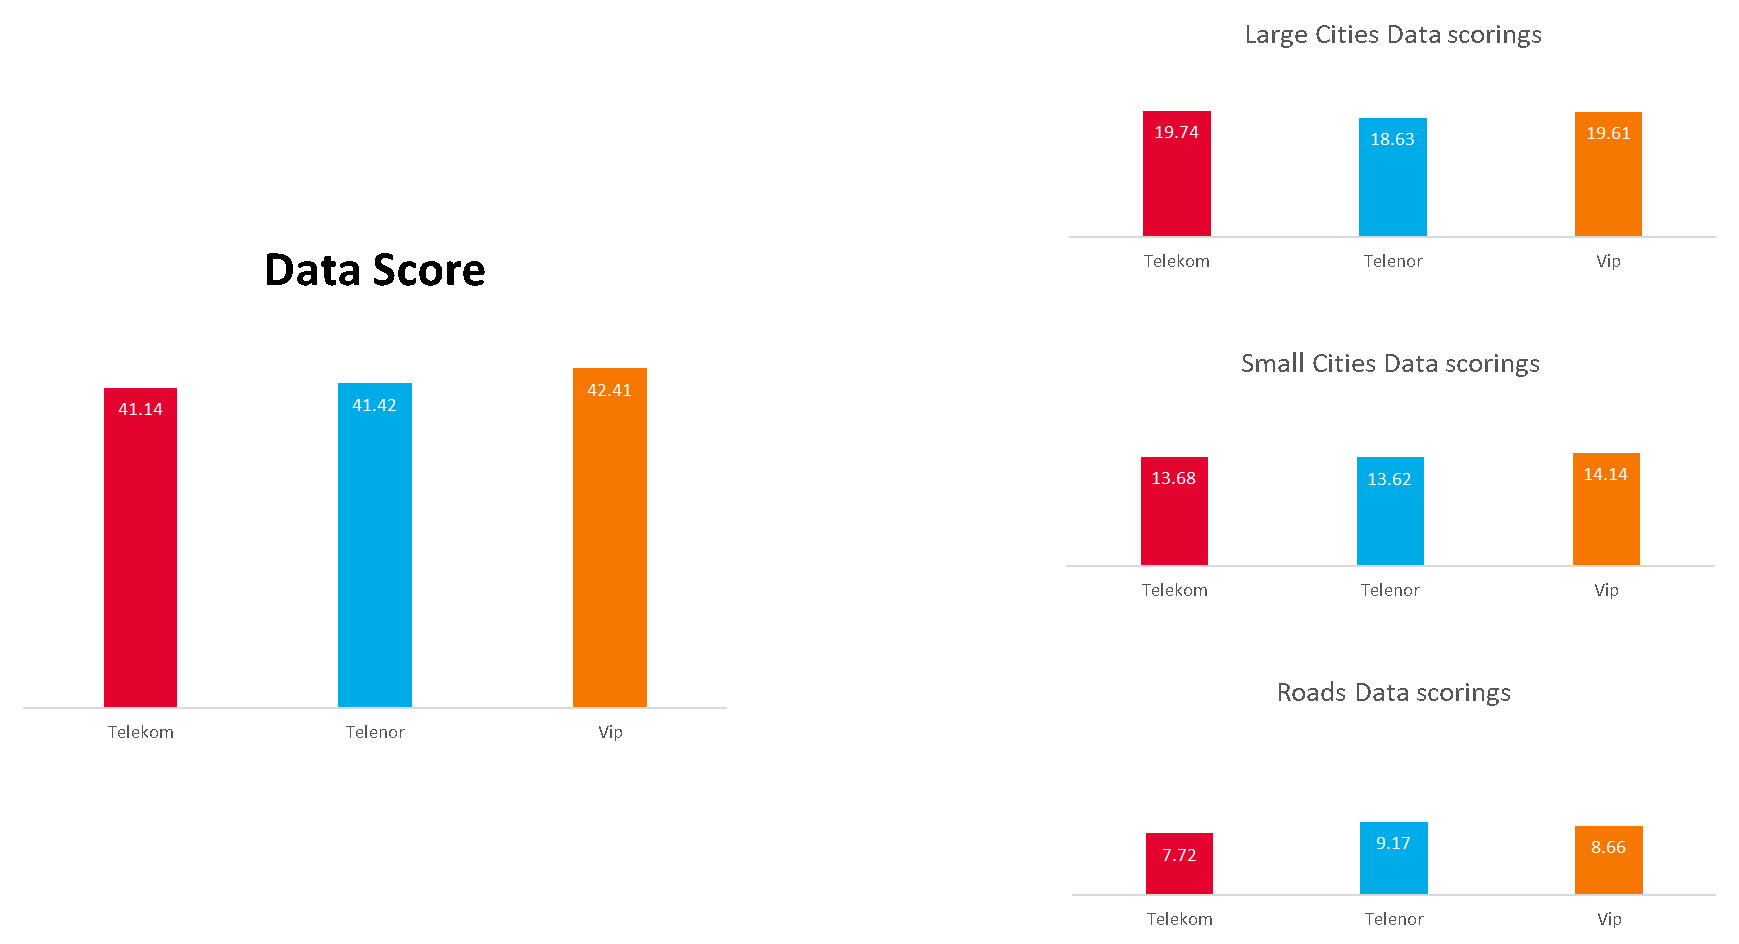
Fig.3. Final and Aggregation Data scorings for all three operators
Results by 4 main categories of services for all three operators are shown in Figure 2. Values for respective services show the percentage of maximum score achieved, to assess the gap in quality.
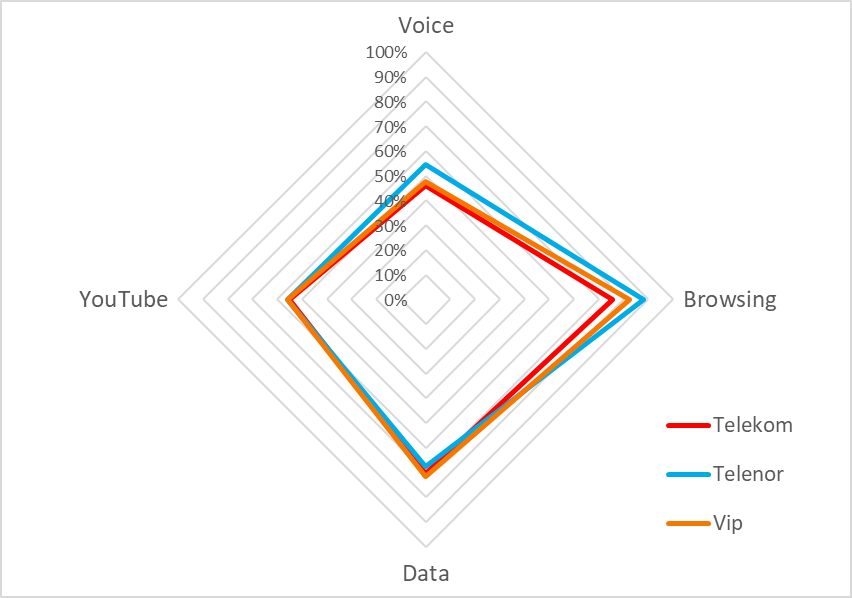
Fig.4. Results by 4 main categories of services for all three operators
All three mobile operators achieve acceptable KPIs levels in Large Cities and Small Cities for voice services. On Roads voice tests were on the level which requires improvements:
Telenor presented the best voice performance, mainly because of its high availability of voice service. Telekom Srbija and Vip mobile depicted similar quality of service, with Vip mobile being slightly ahead due to the better voice quality. Telekom Srbija achieved the shortest call setup times.
The quality of data services offered by all three mobile operators is much better than for voice services. Telekom Srbija and Vip mobile showed the best data performance and scored between 70% and 80% of maximum points in all data tests. Despite higher usage of Carrier Aggregation (combination of multiple carrier frequencies enabling higher data throughputs) and better radio signal level of the Telenor network compared to the other two mobile networks, Telenor used a 10 MHz bandwidth for most of the data tests and therefore did not achieve lead in the data tests category. Telekom Srbija and Vip mobile showed similar performance during data tests, with Vip mobile being ahead due to higher throughputs.
Telenor was better than competitors in web browsing tests, because of high availability of web services. All operators had similar performance of YouTube tests.