The main challenge is to select Key Performance Indicators (KPIs) which represent true user experience, and to develop the algorithm which allows the calculation of the unified quality metric for every operator – the score. In the Systemics-PAB approach, the score reflects user experience and is focused on issues which have high influence on users’ dissatisfaction.
For every service tested, there are at least two metrics identified as meeting the above mentioned idea of scoring.
The usability of the service is assessed using Call or Session Success Rate (CSR for voice tests or SSR for data tests). CSR/SSR is an indicator tested for all types of the services and it is considered as a ratio of successful tests (successful setup and correct termination) to all test attempts. The exact method of calculation is presented with the formula below:
| CSR/ SSR = | all test attempts for the service – failed attempts – dropped connections |
| all test attempts for the service |
The second metric is the quality of the given service itself. This metric will depend on the type of test executed. For voice calls it is assessed as speech quality, while for data tests it is assessed as data throughput, session time or video stream quality in case of YouTube tests. For services where it is important to have the consistent quality of the service, the usability of the service is additionally assessed by calculating the percentage of tests or samples with bad quality (voice samples with a MOS <2.3 for voice tests, data transfer tests with a throughput below the minimum expected value). This approach reflects how the network is dealing with the consistency of quality (distribution of the quality of the service should be close to an average value).
MOS stands for Mean Opinion Score for quality of voice services. It measures perception of the voice quality by the listener. It ranges between 1 and 5, with 5 being the best.
For each of the KPIs measured, there is a threshold assumed as a minimum requirement which has to be met in order to achieve scoring points. This threshold is set at the level representing the status of technology development (minimum data throughputs meeting assumptions for the implementation of the 3G or 4G technologies), the usable quality of service (MOS threshold below which speech quality is poor), network accessibility levels, corresponding to the grade of service used for telecommunication services.
The quality KPIs also have maximum values used for scoring calculations, which is interpreted as a target above which users do not feel the real difference in quality of service, and due to this effect, it is not a differentiating factor in the user’s perception. Operators are not awarded with additional points for exceeding this maximum threshold.
For all KPIs, a linear function is used to calculate how a given KPI meets expectations (within min-max ranges). If a higher value of the KPI is better, the particular score is calculated straight forward (i.e. speech quality or throughput), if a lower value is better, calculations are performed in a reversed way (i.e. call setup time or share of samples with low throughput).
Data gathered during benchmarking tests are used to calculate ranking scores for all measured mobile operators for voice and data services.
The importance of the voice service is set to 40%, while all data services sum up to a total of 60%.
The first step for calculating the single score is to calculate the score for the different aggregations as:
Particular area scores are calculated separately using the defined weights and thresholds for types of services tested. The final score is a weighted aggregation of the scores obtained in these areas. The areas scores contribute to the final scoring with weights relevant to their importance. The following weights are used for the aggregations: Large Cities 40%, Small Cities 30% and Roads 30%.
The final score, the same as the scores for each of the individual areas, is presented as single percentage value which can be interpreted as level of fulfilling expectations/capabilities. It ranges from 0 to 100 percent. The scoring calculation process is presented in Figure 1.
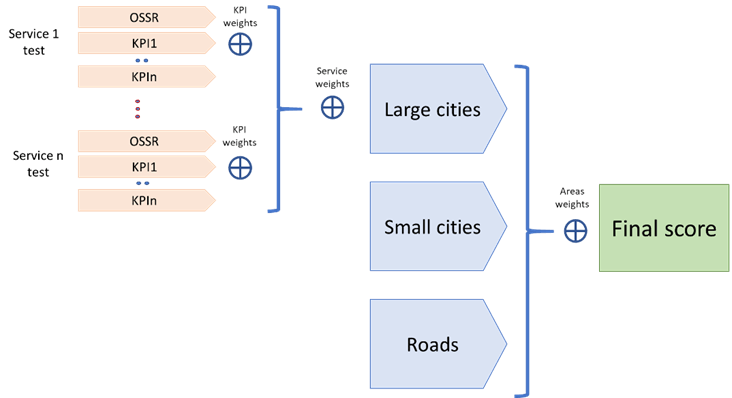
Fig. 1. Scoring calculations