It is important to notice that the 2022 Benchmark scoring campaign was assessed according to ETSI 103 559 Annex A scoring methodology.
In assessing the overall performance and the overall score of each mobile network, next categories of services have been evaluated:
The above-mentioned categorisation is being applied in parallel with the area categorisation. Based on ETSI 103 559 Annex A, three main area types are distinguished, which are then further divided.
Having applied this methodology, Telekom Srbija achieved 88.70 (out of 100) scoring points, followed by A1 Srbija with 86.98 (out of 100) scoring points and Yettel with 84.06 (out of 100) scoring points.
Telekom Srbija achieved the best results during this year’s benchmark campaign. The result of A1 Srbija was the second-best. Yettel was behind the competitors.
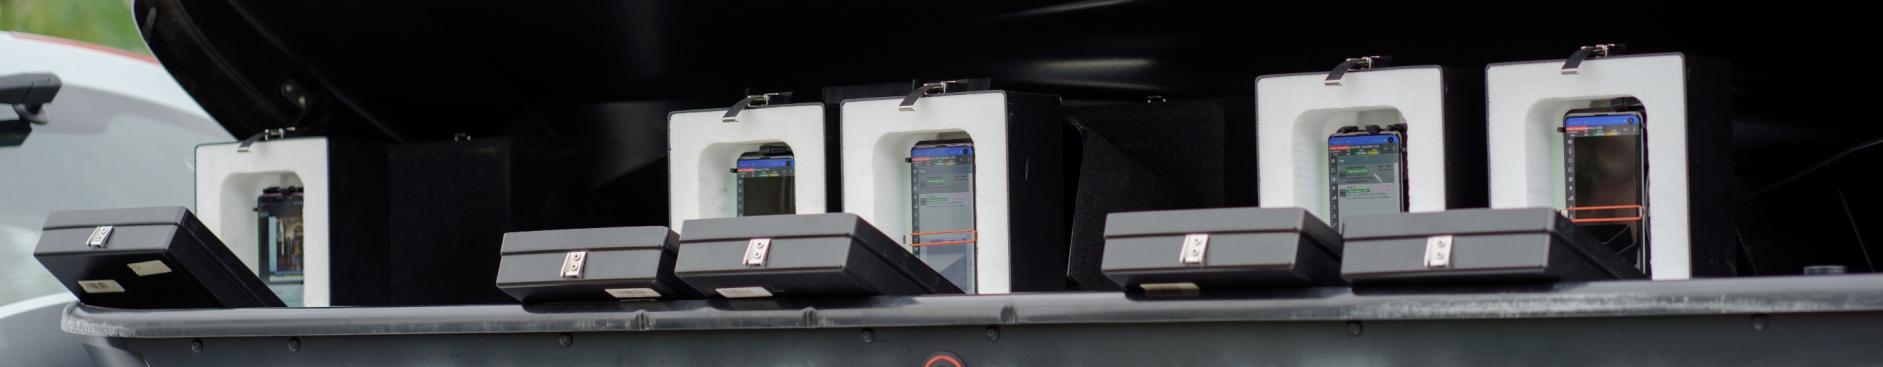
The Mobile Network Benchmarking results achieved in each category of services and on every measurement aggregation, as well as the overall scores achieved, are presented in Figure 1 below. Values for aggregations on the right are weighted values, as used for the calculation of the final score.
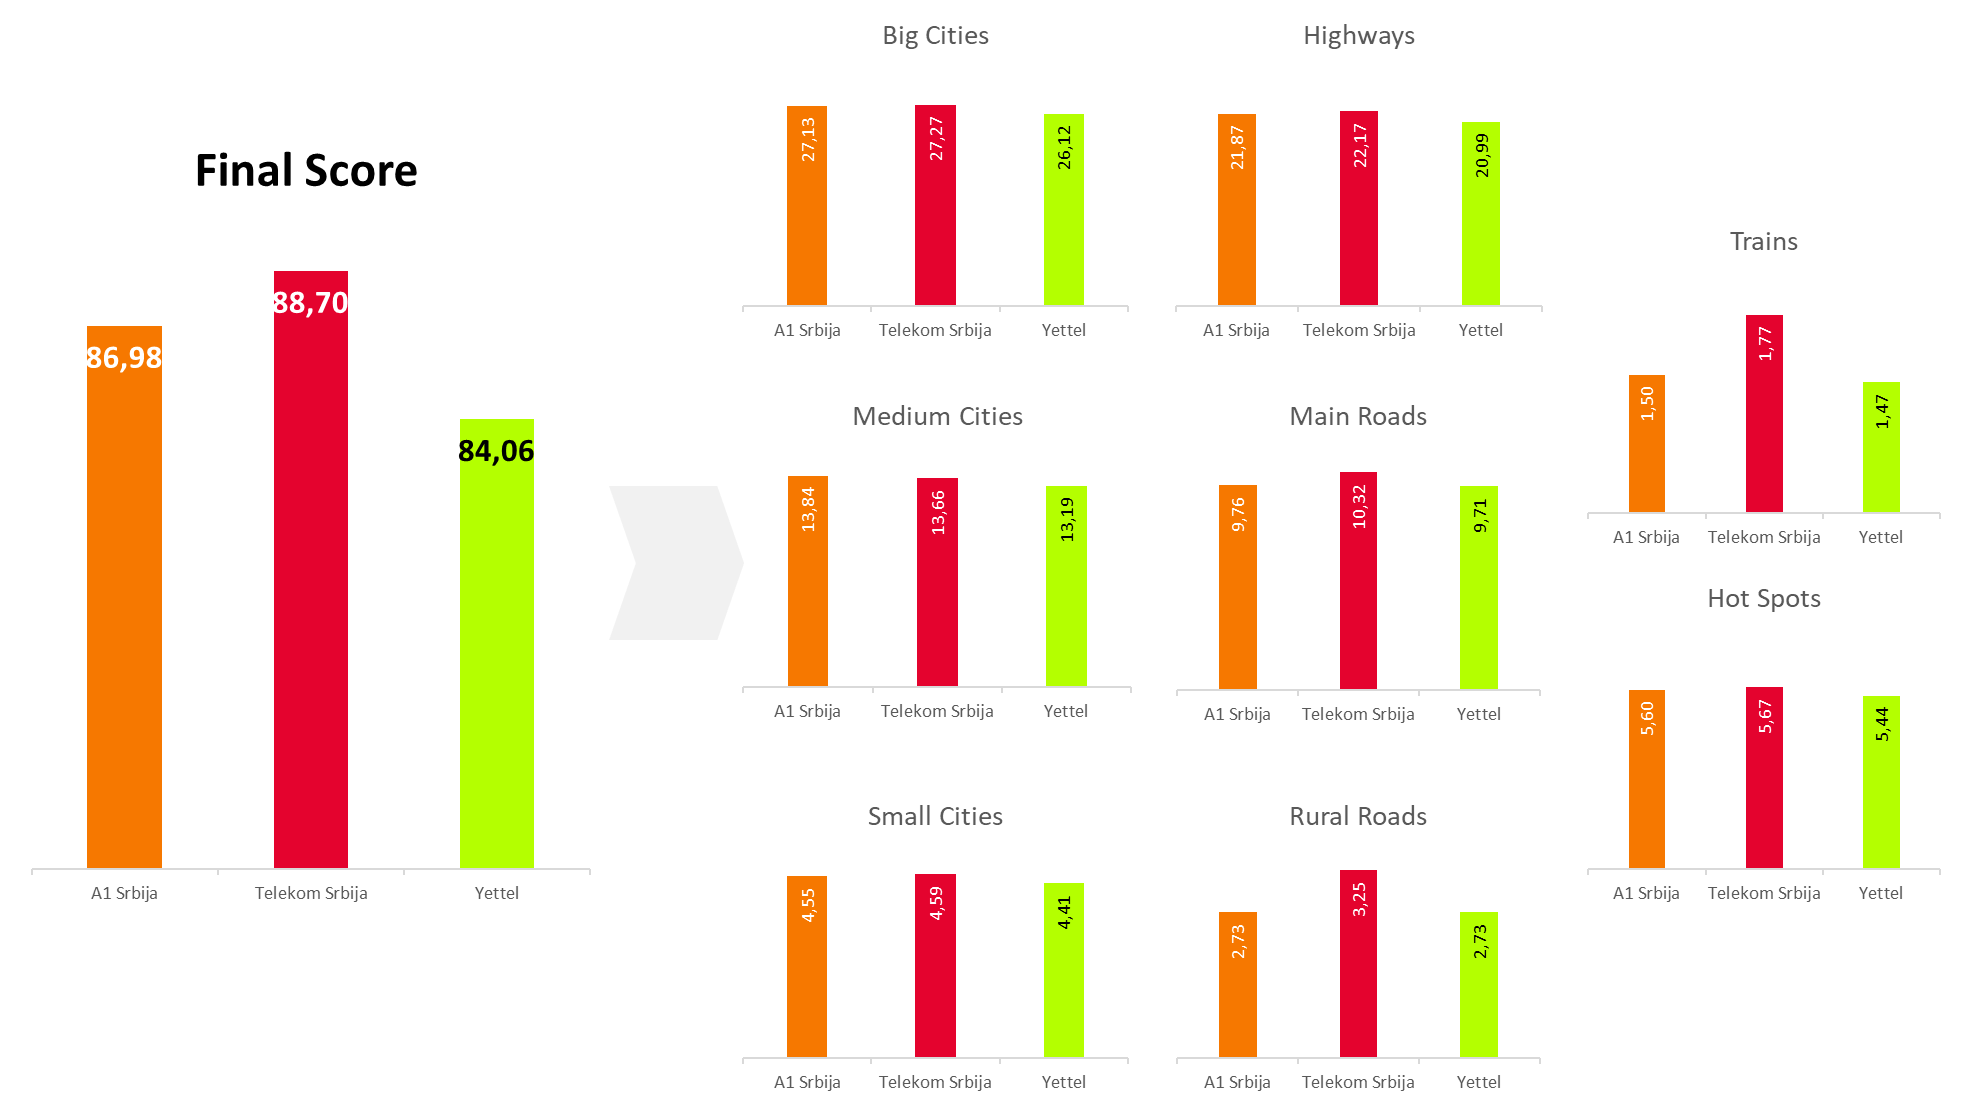
Fig.1. Final and Aggregation scorings for all three operators
The Voice services scores achieved are presented in Figure 2 below.
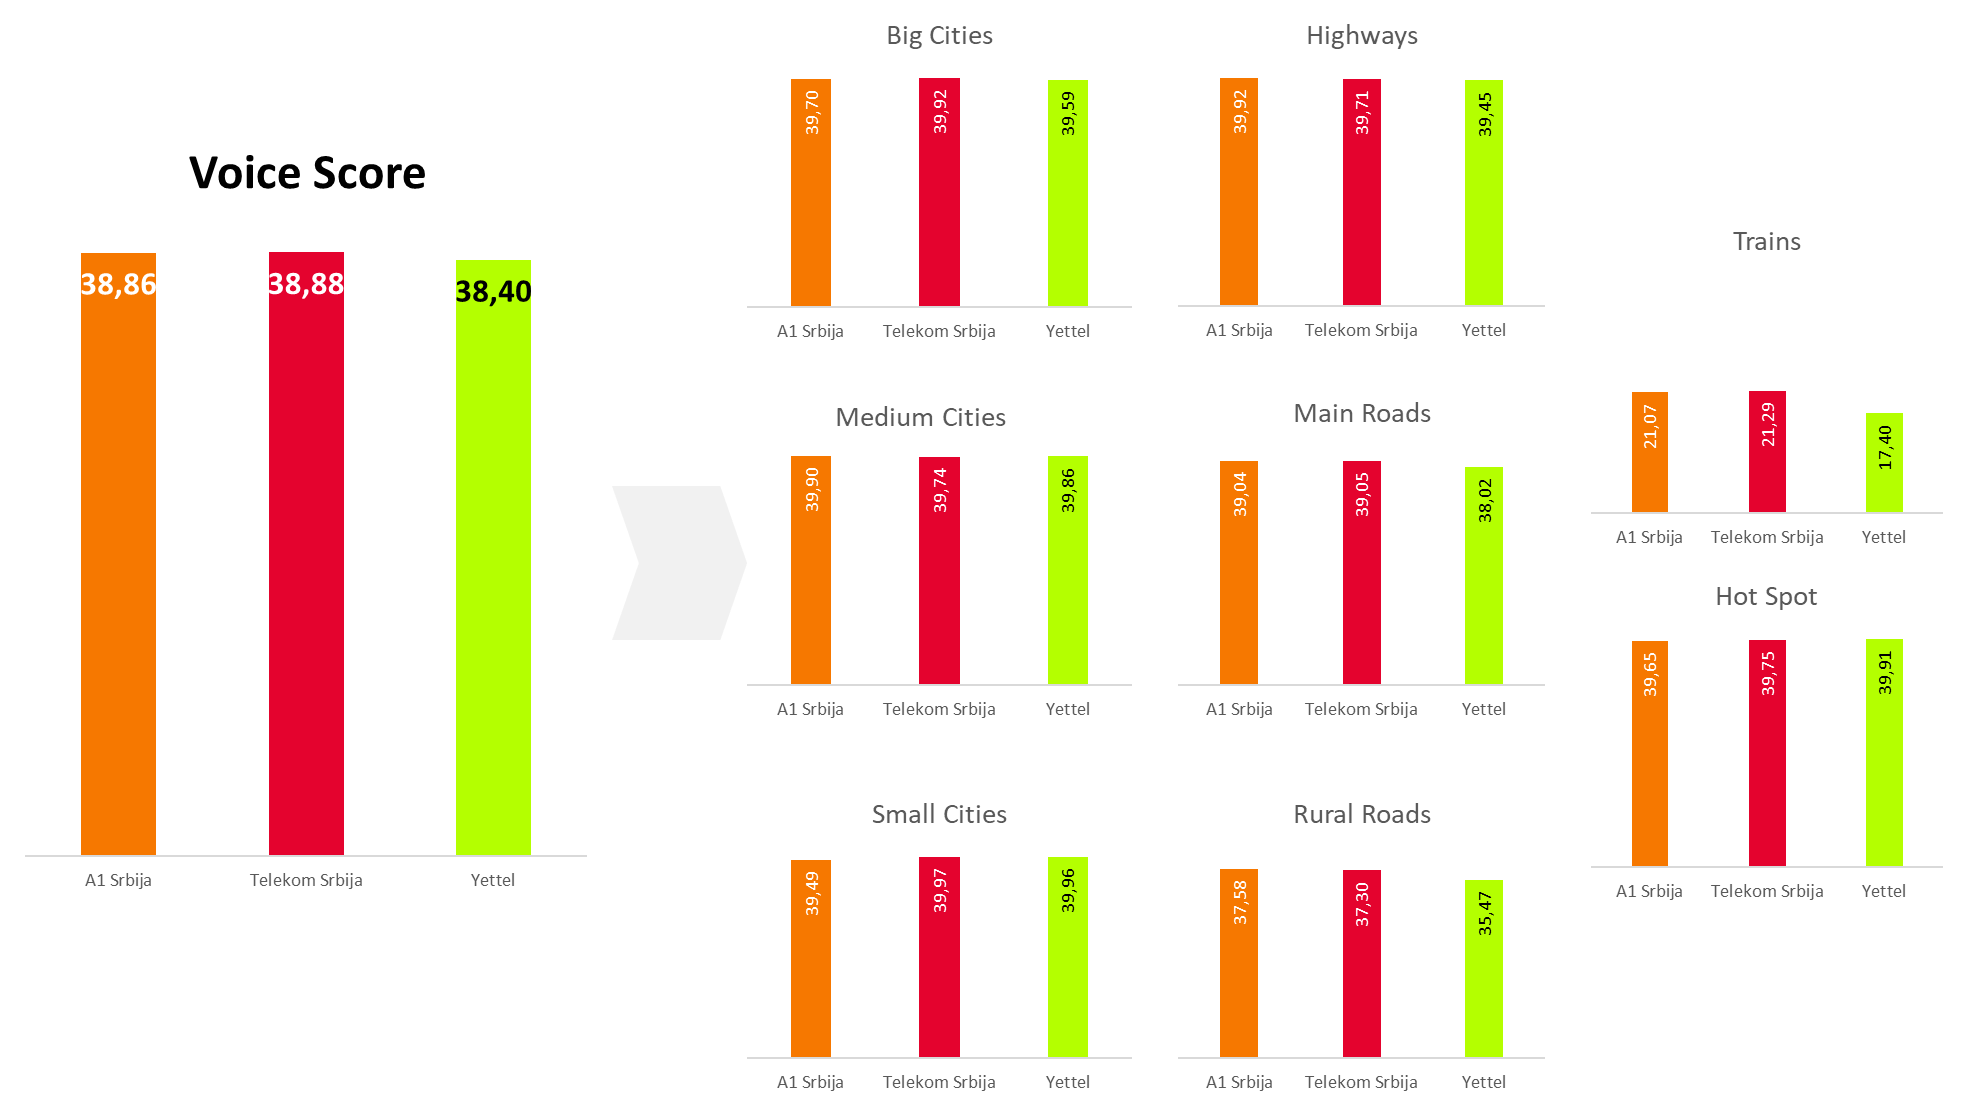
Fig.2. Final and Aggregation Voice scorings for all three operators
Scores for data tests including data transfer (DL/UL), web browsing, YouTube and messaging are presented on Figure 3 below.
Fig.3. Final and Aggregation Data scorings for all three operators
Results for the 5 main categories of services for all three operators are shown in Figure 4. Values for the respective services show the percentage of the maximum score achieved, to assess the gap in quality.
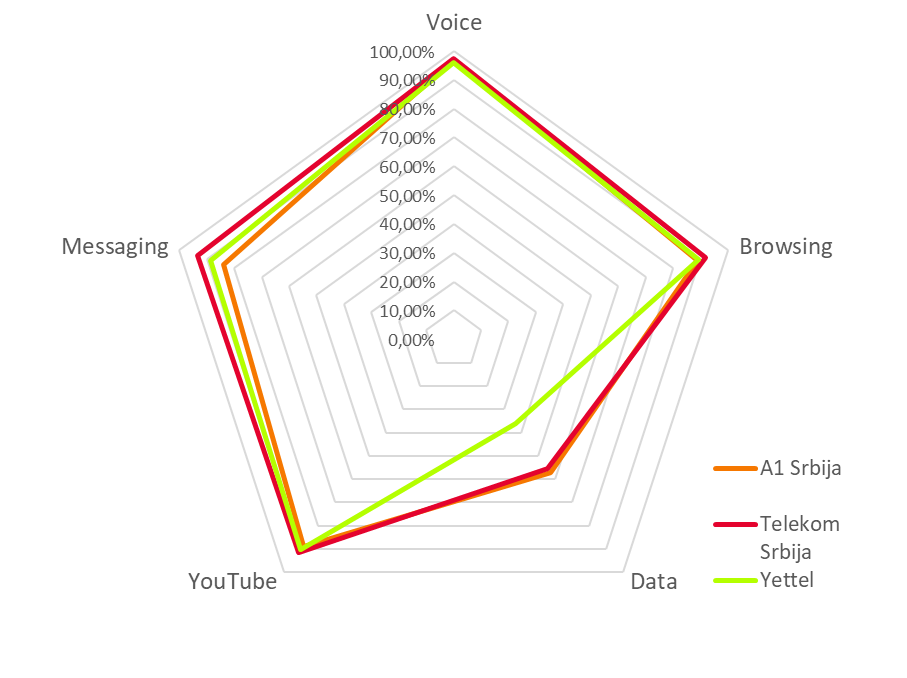
Fig.4. Results by 4 main categories of services for all three operators
All three mobile operators achieved good KPI levels in most of the aggregations for voice services. In Trains, the quality of voice service is poorer for all of them. These results require improvement. Yettel had the highest percentage of bad voice samples on Roads.
Telekom Srbija scored best in most of data type services. In data transfer DL performance A1 Srbija showed similar, but better results than Telekom Srbija. Both operators scored between 55% and 60% of maximum points in this test. A1 Srbija was slightly ahead, due to higher throughputs for small file transfer DL. Yettel was ranked last, mainly due to poor performance on data transfer DL tests.