The selected KPIs for data tests achieved by operators with the split per the aggregation type are presented in Figure 1. Those show differences between operators for browsing, data transfer and YouTube video watching.
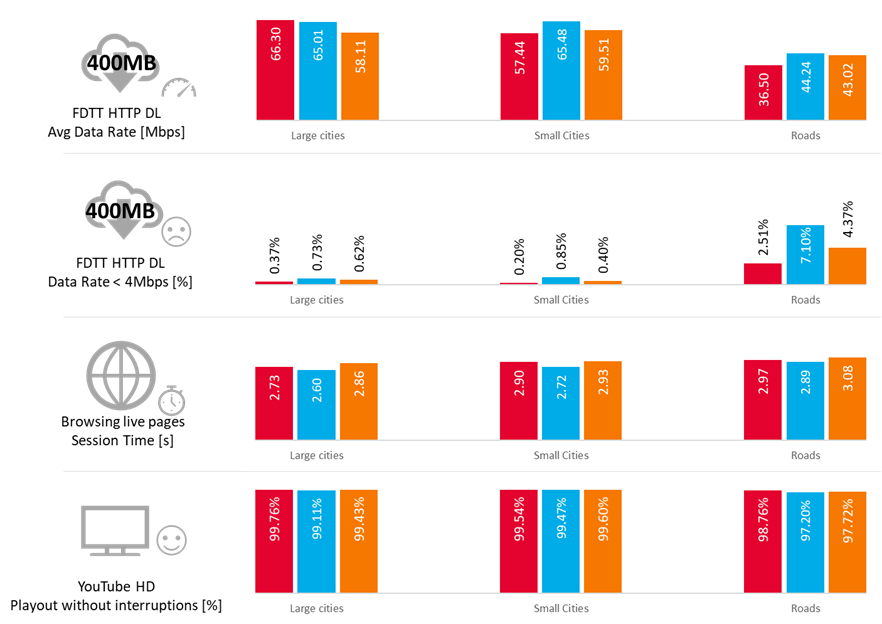
Fig. 1. Selected KPI from data test
Results for FDTT HTTP DL (400 MB file transmission) tests are presented in Figure 2.
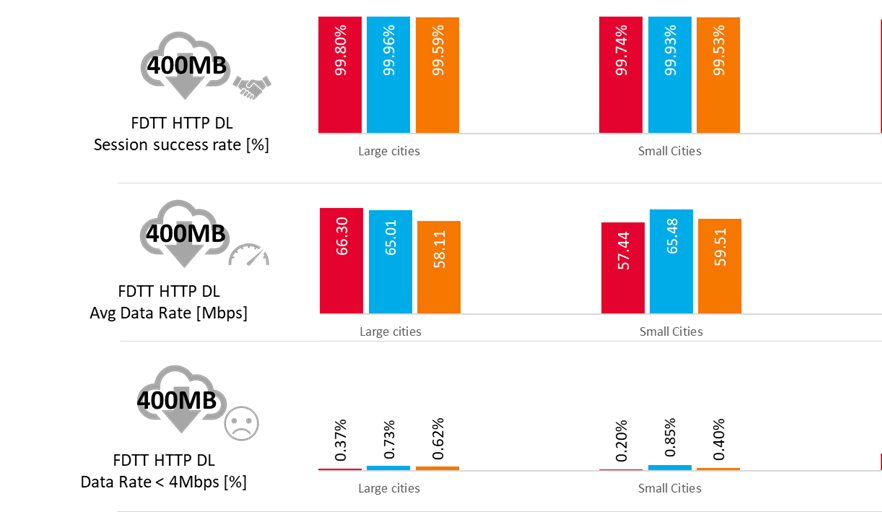
Fig. 2. KPIs results for FDTT HTTP Capacity Transfer - Download (FDTT HTTP DL)
Large Cities:
All operators had near perfect session success rates. Telekom Srbija and Telenor with average data rate at similar level, Vip mobile slightly behind the competitors. All three mobile operators had a low share of samples with data rate below 4 Mbps. All three operators achieved high data rates due to the Carrier Aggregation (CA) usage.
Small Cities:
In Small Cities, the success rate was nearly the same for all competitors. Carrier Aggregation (CA) usage was smaller compared to Large Cities, with only Telenor CA usage on similar level as in Large Cities. Telenor achieved the highest average data rate, Vip mobile was second and Telekom Srbija was third.
Roads:
Telekom Srbija took the lead in terms of success rate, with Telenor following and Vip mobile remaining behind by 7 percent. In terms of data rate, Telenor had an advantage over competitors. Despite the highest usage of Carrier Aggregation, Telenor did not achieve much better results than competitors in the matter of average data rate, being only 1Mbps faster than Vip mobile which was second (43.02 Mbps).
Large Cities
Results for FDTT HTTP DL throughputs in Large Cities are shown in Figure 3. They show the average and maximum network capabilities in delivering the highest continuous throughput. Telekom Srbija achieved the highest average data rate, followed by Telenor and Vip Mobile. Telenor achieved the highest peak data rate.
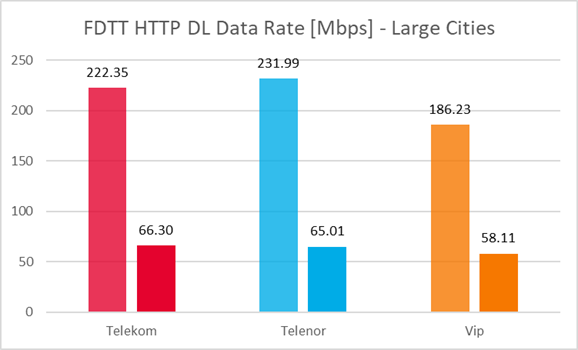
Fig. 3. FDTT HTTP DL throughputs in Large Cities
Small Cities
Results for FDTT HTTP DL throughputs in Small Cities are presented in Figure 4. Although Telekom Srbija achieved the highest maximum data rate (230.42 Mbps), its average data rate was the lowest. Telenor had the highest average data rate, Vip mobile was second.
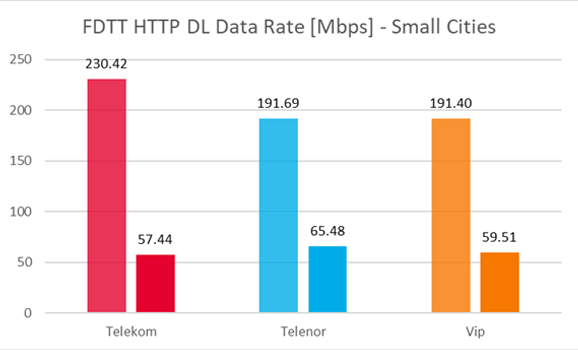
Fig. 4. FDTT HTTP DL throughputs in Small Cities
Roads
Results for FDTT HTTP DL throughputs on the Roads are presented in Figure 5. Again, Telekom Srbija had the highest maximum throughput results. Telenor achieved the highest average data rate, Vip mobile was second and Telekom Srbija was third.
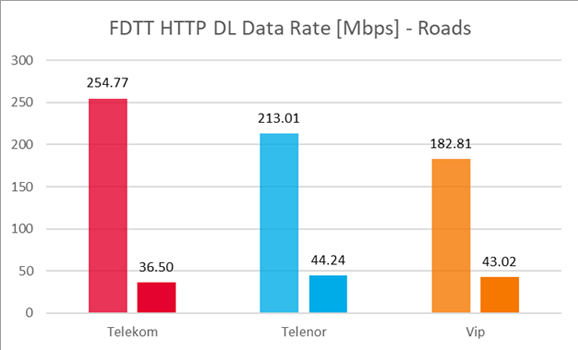
Fig. 5. FDTT HTTP DL throughputs on Roads
Results for FDTT HTTP UL (400 MB file transmission) tests are presented in Figure 6.
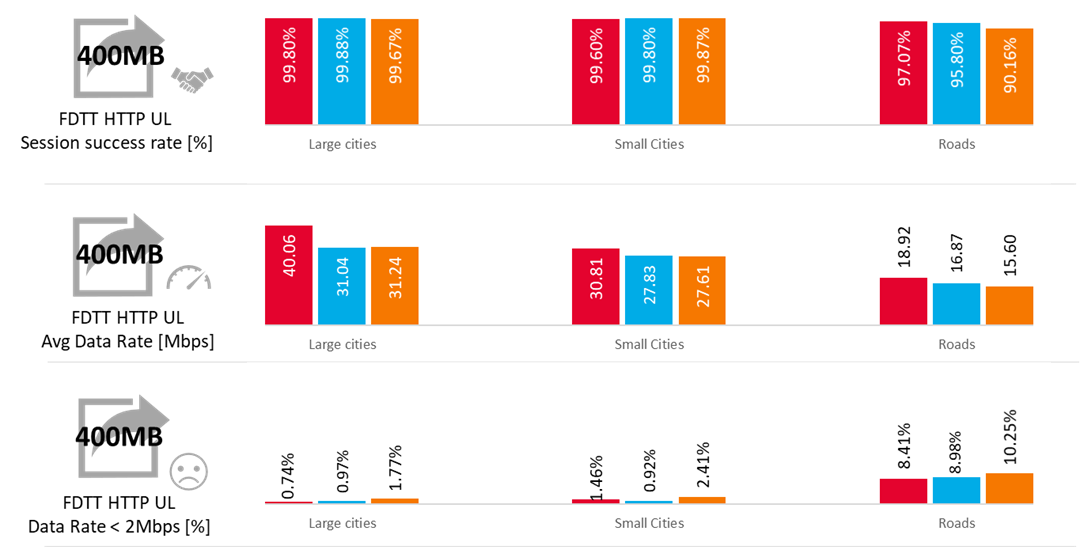
Fig. 6. KPIs results for FDTT HTTP Capacity Transfer – Upload (FDTT HTTP UL)
Large Cities:
All operators had near perfect overall success rates and very high 4G usage. Telekom Srbija had the best average data rate. All three operators had a low percentage of samples below 2 Mbps.
Small Cities:
The success rate in Small Cities was still on a near perfect level. The average data rate values were lower compared to the ones in Large Cities.
Roads:
The success rate for Telekom Srbija and Telenor was on a good level. Vip mobile was behind the competition. The average data rate was much lower than in the cities. Vip mobile had the most samples with low throughput (over 10%).
Results for HTTP DL 3 MB tests are presented in Figure 7.
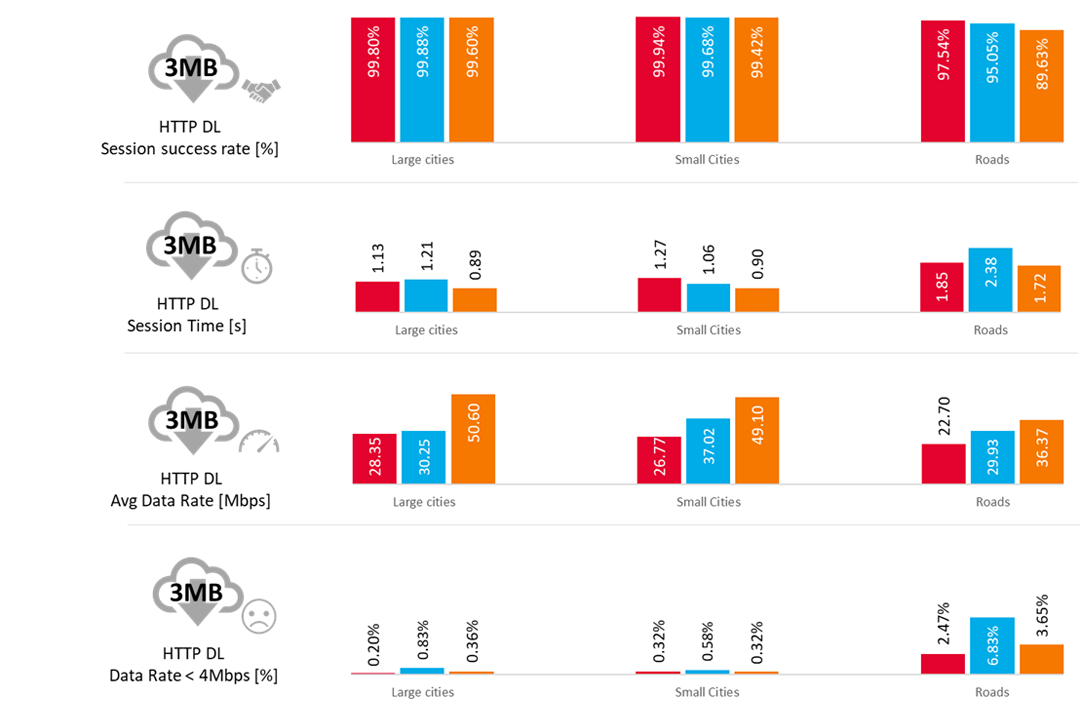
Fig. 7. KPIs results for HTTP File Transfer - Download (HTTP DL 3 MB)
Large Cities:
All operators achieved excellent session success rates. Vip mobile had the shortest average session time and the highest average data rate. Telenor had more samples with low throughput comparing to the competition
Small Cities:
Similarly to the Large Cities, Vip mobile had the best overall results, with Telenor being second and Telekom Srbija third. All operators had similar number of samples with a data rate less than 4 Mbps.
Roads:
As expected, session success rates on Roads were lower compared to cities. Overall, Vip mobile had the shortest session time and highest average data rate, but lowest session success rate. Telenor scored second in the matter of average data rate, but due to the highest percent of samples with data rate below 4 Mbps, had the longest session time.
Results for HTTP UL 1 MB tests are shown in Figure 8.
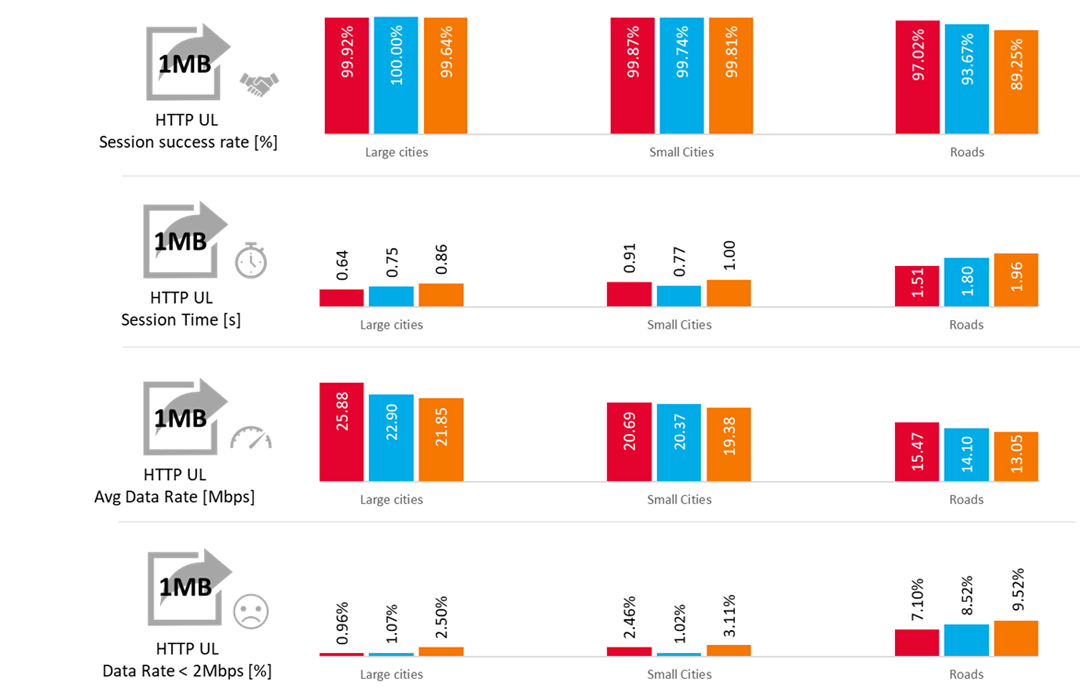
Fig. 8. KPIs results for HTTP File Transfer - Upload (HTTP UL 1MB)
Large Cities:
In Large Cities, Telenor achieved perfect session success rate. The other competitors had very good session success rates, achieving similar results. Telekom Srbija had the best data rate and average session time.
Small Cities:
In Small Cities, all operators had very good success rates. Telekom Srbija and Telenor were with almost equal average data rate and session time. All operators performed on similar level.
Roads:
As expected, the success rates on Roads were lower compared to cities. Overall, Telekom Srbija was leading with highest average data rate and lowest percent of samples with data rate below 2Mbps. Vip Mobile was with session success rate below expectations, with result of 89.25%.
Tests results for HTTP Browsing tests are presented in Figure 9.
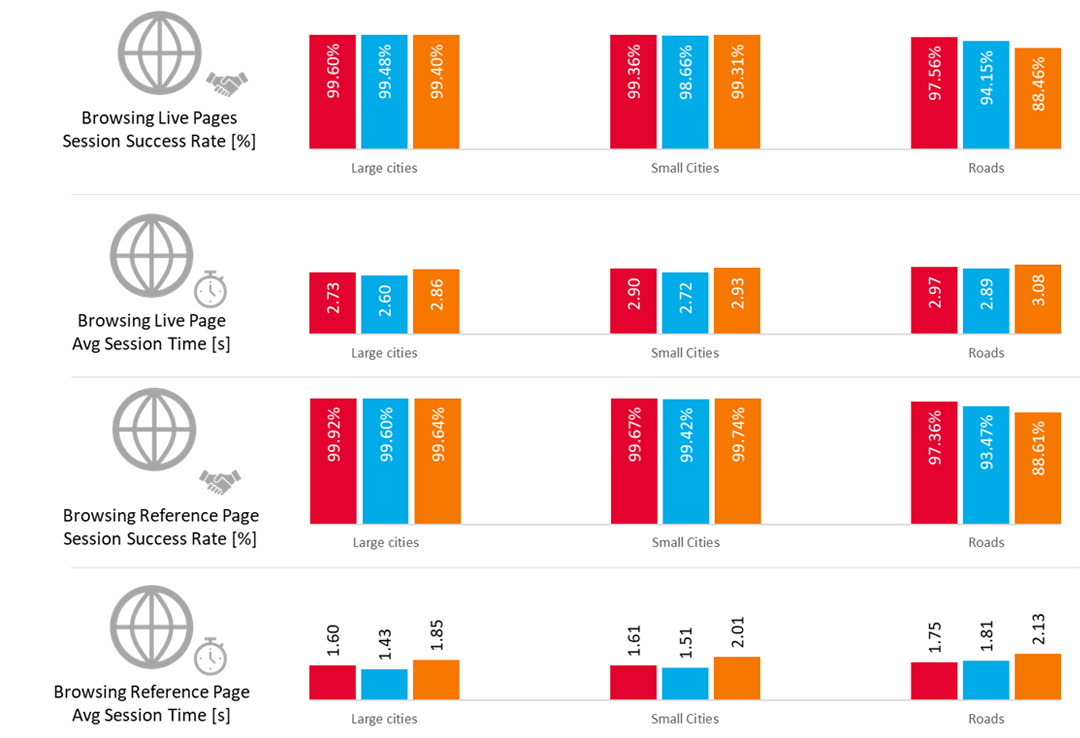
Fig. 9. KPIs results for HTTP Browsing tests
Large Cities:
Success rates for both live and reference web pages were on a very good level for all three operators, since all operators had a very high 4G utilization resulting in low session times. Telenor had the best session times.
Small Cities:
In Small Cities, similarly to large cites, the success rates were very good. Telenor had the shortest session time, Telekom Srbija and Vip mobile were on the same level for live pages.
Roads:
Success rates were much lower on the Roads compared to the cities. Telekom Srbija was the best overall, with the shortest session time for reference page and the best session success rate. Vip mobile had session success rate below expectations (88.46%).
YouTube video quality tests were performed according to ITU Recommendation J.343.1, which is relevant for the assessment of quality at the user end. The model measures the visual effect of spatial and temporal degradations as a result of video coding, erroneous transmission or video rescaling. The J.341.1 model is a no reference method, which allows assessing the quality of any content, even from unknown sources. The live streaming content was used to observe and measure quality of the video with real time data transmission to avoid buffering of whole clip and playing it from memory. As a result, the model provides a subjective assessment of visual quality on the 1 to 5 mean opinion score scale for video (VMOS).
YouTube test results of testing the quality of live stream video transmission are presented in Figure 10.
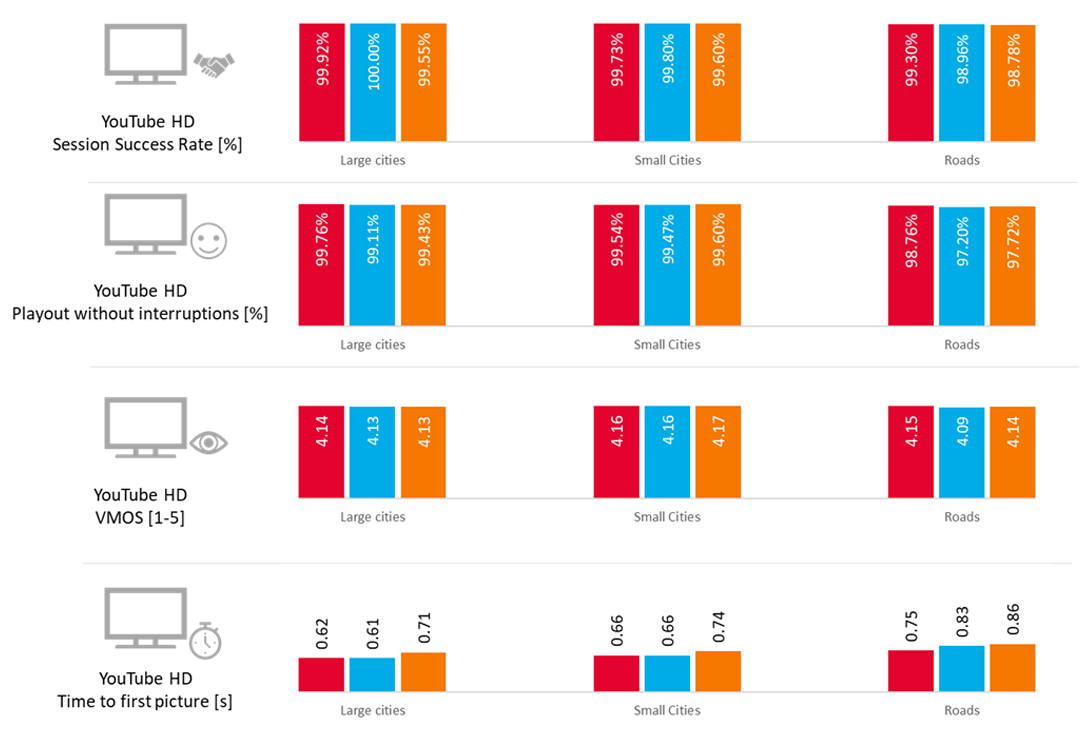
Fig. 10. KPIs results for YouTube video tests
Large Cities:
All operators had very similar results in success rates and the number of playouts without interruptions. Telekom Srbija had the best average video quality, Telenor and Vip mobile on tied even.
Small Cities:
In Small Cities, similarly to Large Cities, operators had very good results. Vip mobile presented the best average video quality. All operators performed on very similar level.
Roads:
On Roads, similarly to other aggregations, the session success rate achieved by operators was on a very good level. Slight degradation in number of playouts without interruptions could be noticed.
Ping test results are presented in Figure 11.
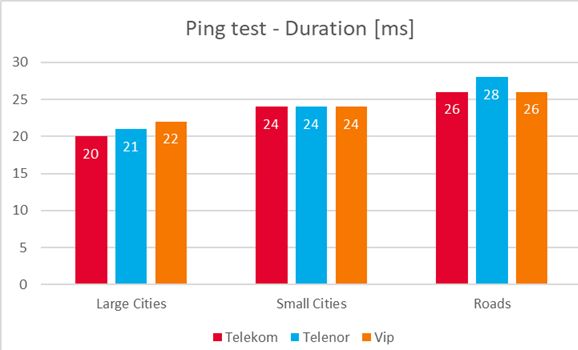
Fig. 11. Ping test – Duration
Large Cities:
Average latency was on a very good level for all three operators, below 30 ms, which is a value typical for 4G networks. Telekom Srbija had the best results.
Small Cities:
Average latency was on a very good level for all three operators. All operators achieved the same level of ping duration of 24 ms.
Roads:
On the Roads, compared to the cities, the average ping duration degraded slightly for Telenor, to a value of 28ms, which is still a very good result.