Please note that in order to distinguish two campaigns’ results compared, the following shade code was used. The lightest bar colour was used to represent 2017 results, then 2018, darker for 2019 results and darkest for 2020 results. The example is presented in Figure 1.
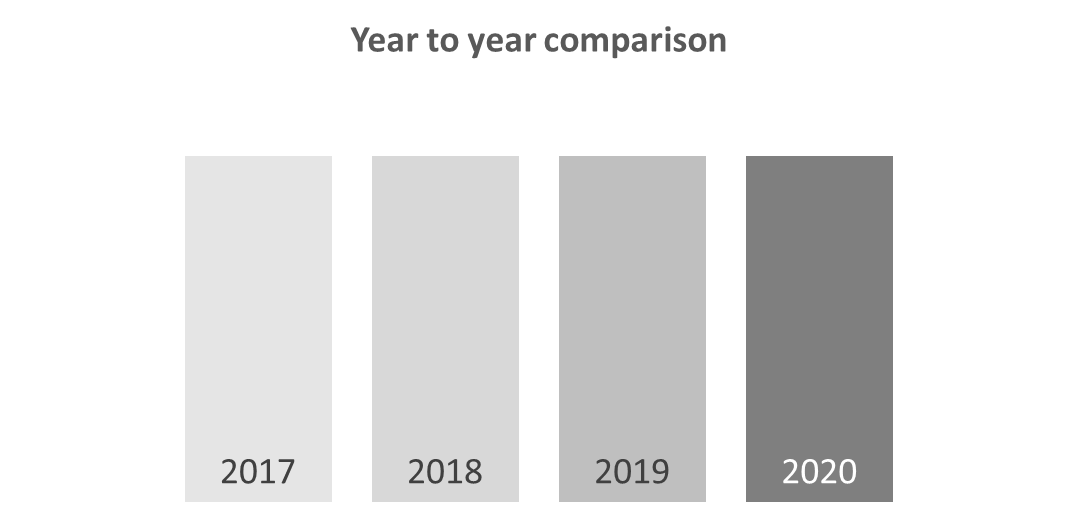
Fig. 1. Year to year comparison shades codes
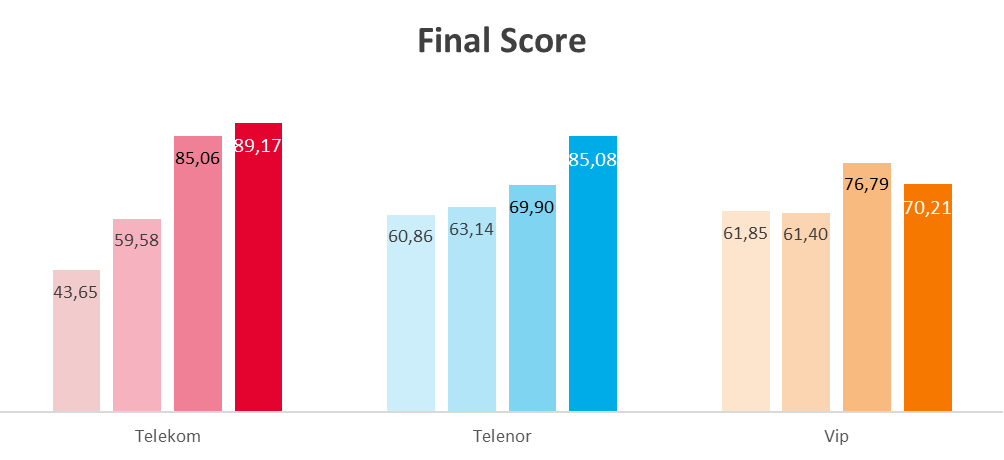
Fig. 2. Final scores comparison
Telekom Srbija scored the best in 2020 due to large improvement across all services types and aggregations. Telenor was second thanks to good performance and VoLTE introduction before this year’s campaign. VIP mobile took the last place due to issues with DNS server impacting data services.
For better clarity on the next graphs results will be shown for the last 3 years.
The trend analysis of Voice scorings and Data scorings are presented on Figure 3 and Figure 4. Please note that Final Score is the sum of Voice and Data score.
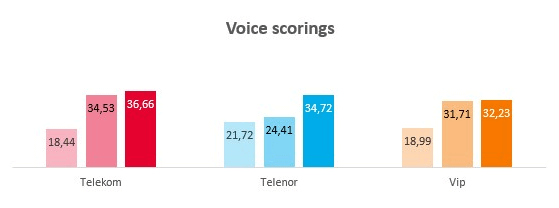
Fig. 3. Final scores comparison
All operators improved the quality of Voice service over the years. Telenor made the biggest year-to-year improvement thanks to VoLTE functionality introduction.
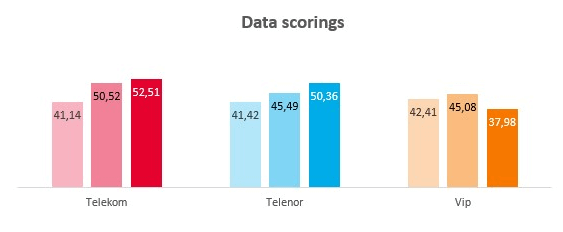
Fig. 4. Final scores comparison
Telekom and Telenor improved Data services year to year. VIP mobile had the DNS server issue during the campaign and therefore performed poorer than in previous years.
The trend analysis of Large Cities scorings, Small Cities scorings and Roads scorings are presented on Figure 5, Figure 6 and Figure 7. Please note that the Final Score is the sum of weighted results of the Large Cities score, Small Cities score, and Roads score.
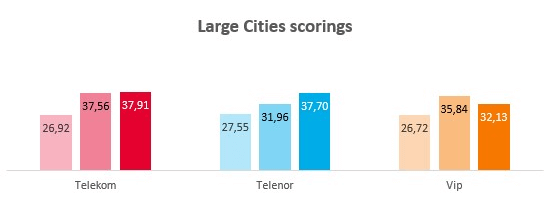
Fig. 5. Large Cities scores comparison
Telekom Srbija and Telenor improved quality of service in Large Cities. The results of these operators are on similar level. The biggest improvement has been noticed for Telenor network due to VoLTE functionality introduction. VIP mobile took the last place due to issues with DNS server impacting data services.
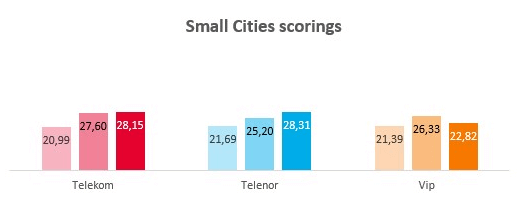
Fig. 6. Small Cities scores comparison
The quality of services improved in Small Cities for Telekom Srbija and Telenor mobile operators. Telenor had the biggest improvement compared to the previous years, with better results across majority of the KPIs.
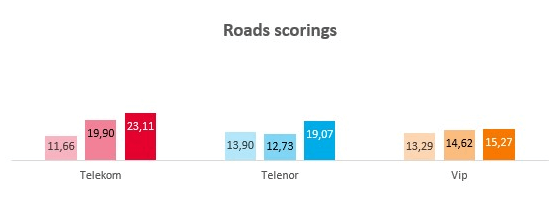
Fig. 7. Roads scores comparison
Observing the results of benchmarking of mobile networks on the Roads, Telekom Srbija showed the highest result, which indicates that this operator improves the quality of service year after year. All operators improved the quality of the services on the Roads. The improvement was seen across most of the KPIs measured. VIP mobile improved the quality to the smallest extend due to DNS server issues.
Voice
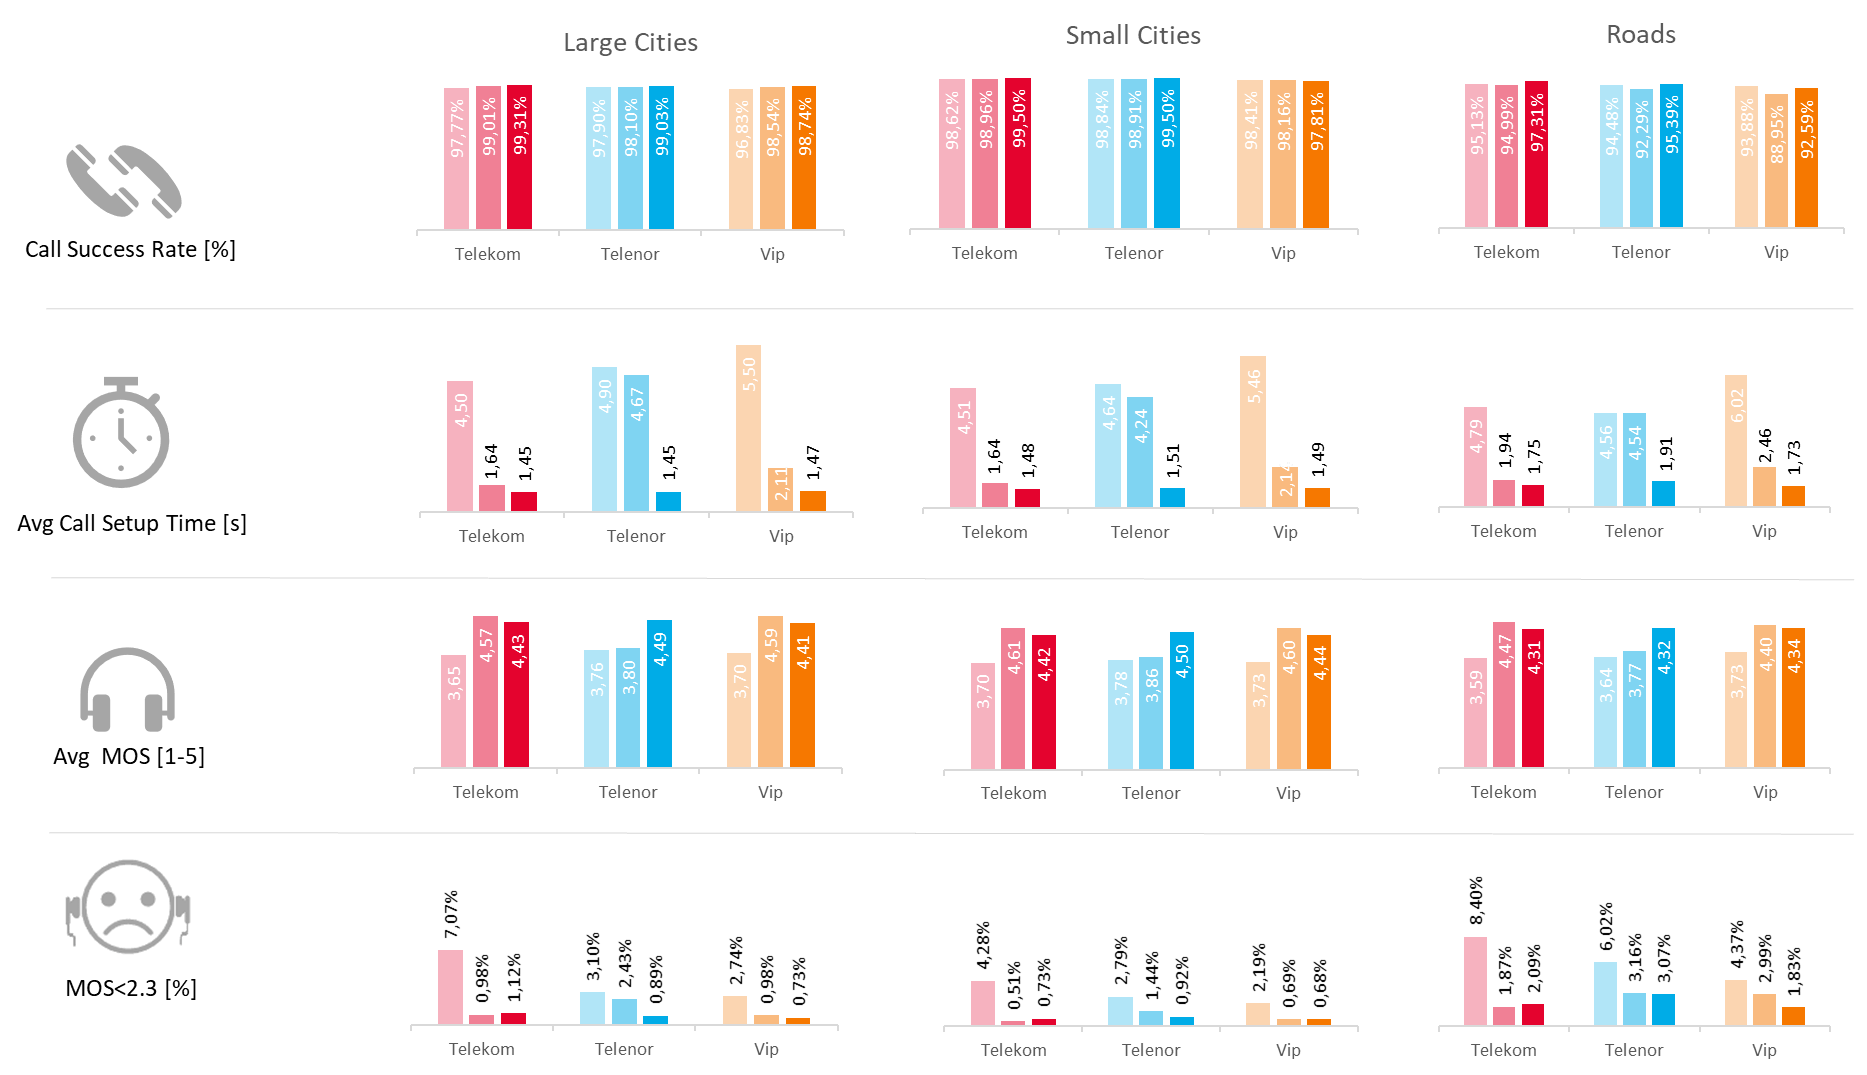
Fig. 8. Selected KPIs from voice tests
Call Success Rate: In Large Cities, Telekom Srbija and Telenor improved success rate, VIP mobile is on the same level. In Small Cities the results for Telekom Srbija and Telenor improved, only Vip mobile had slight degradation. The results collected in Cities were still on a very good level. On the Roads, all operators increased their success rates.
Average Call Setup Time: The noticeable difference is visible in Telenor, which improved greatly due to VoLTE service introduction. Telekom Srbija and VIP mobile also improved but to a lesser extent.
Average MOS score: The perceived voice quality score has improved about 1 point for Telenor due to VoLTE introduction. Telekom Srbija and VIP mobile were with slight decrease in the MOS score.
% of MOS score below 2.3: In all aggregations, Telenor and VIP Mobile improved noticeably when it comes to the number of samples with bad speech quality. Telekom Srbija had slight degradation for this KPI but also had the results still on a very good level.
FDTT HTTP DL
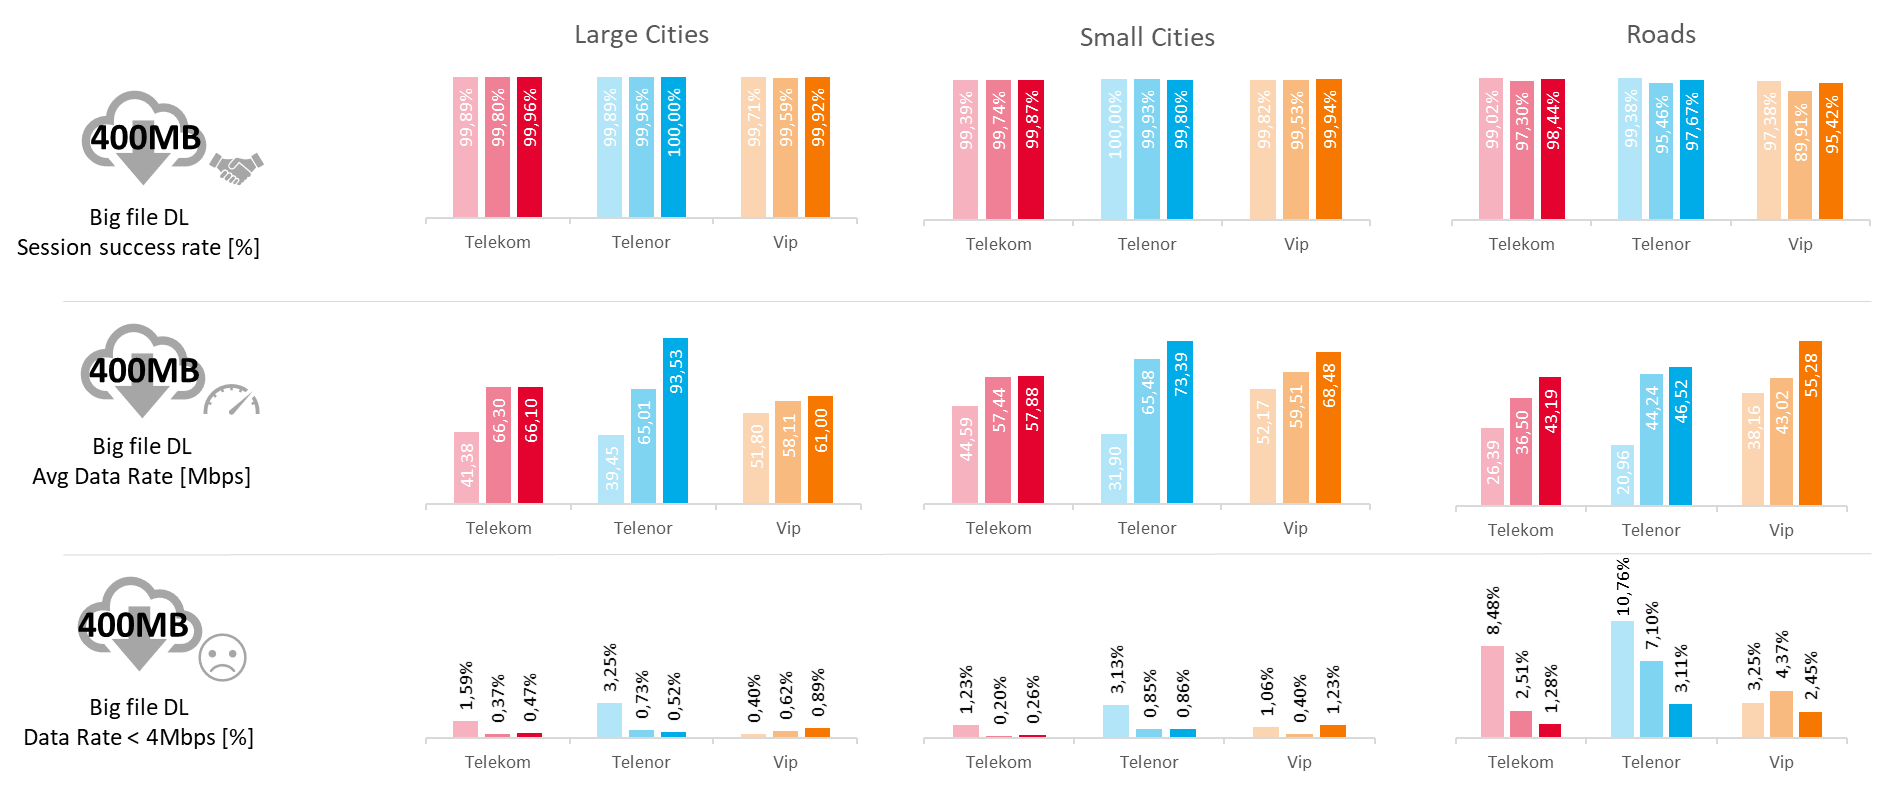
Fig. 9. Selected KPIs from FDTT HTTP DL tests
Session Success Rate provides information about reliability of Internet access for mobile users. During 2020 benchmarking campaign, all operators provided close to excellent results (>99%) for Large and Small cities. The level of quality of service was maintained from 2018 for Large and Small cities. On Roads all operators performed better than in 2019 but the level of results collected in 2018 was still not met.
Average Data Rates measured during 2020 benchmark were improved greatly by Telenor. The results collected were better by 10-30Mbps than in 2019 campaign. Telekom Srbija results were on the same level in Cities. All operators improved average data rates on Roads.
Percentage of Tests with Data Rate below 4Mbps is metric which describes portion of the network not satisfying criteria for minimal user satisfaction for Internet connectivity. If data rate is below 4Mbps, users may have troubles with demanding services like downloading video streams, as well as bulk large downloads. In Cities results for Telekom Srbija and Telenor presented the same level as in 2019. VIP mobile had a slight degradation in Small Cities. On Roads all operators presented lower number of bad samples than in 2019.
FDTT HTTP UL
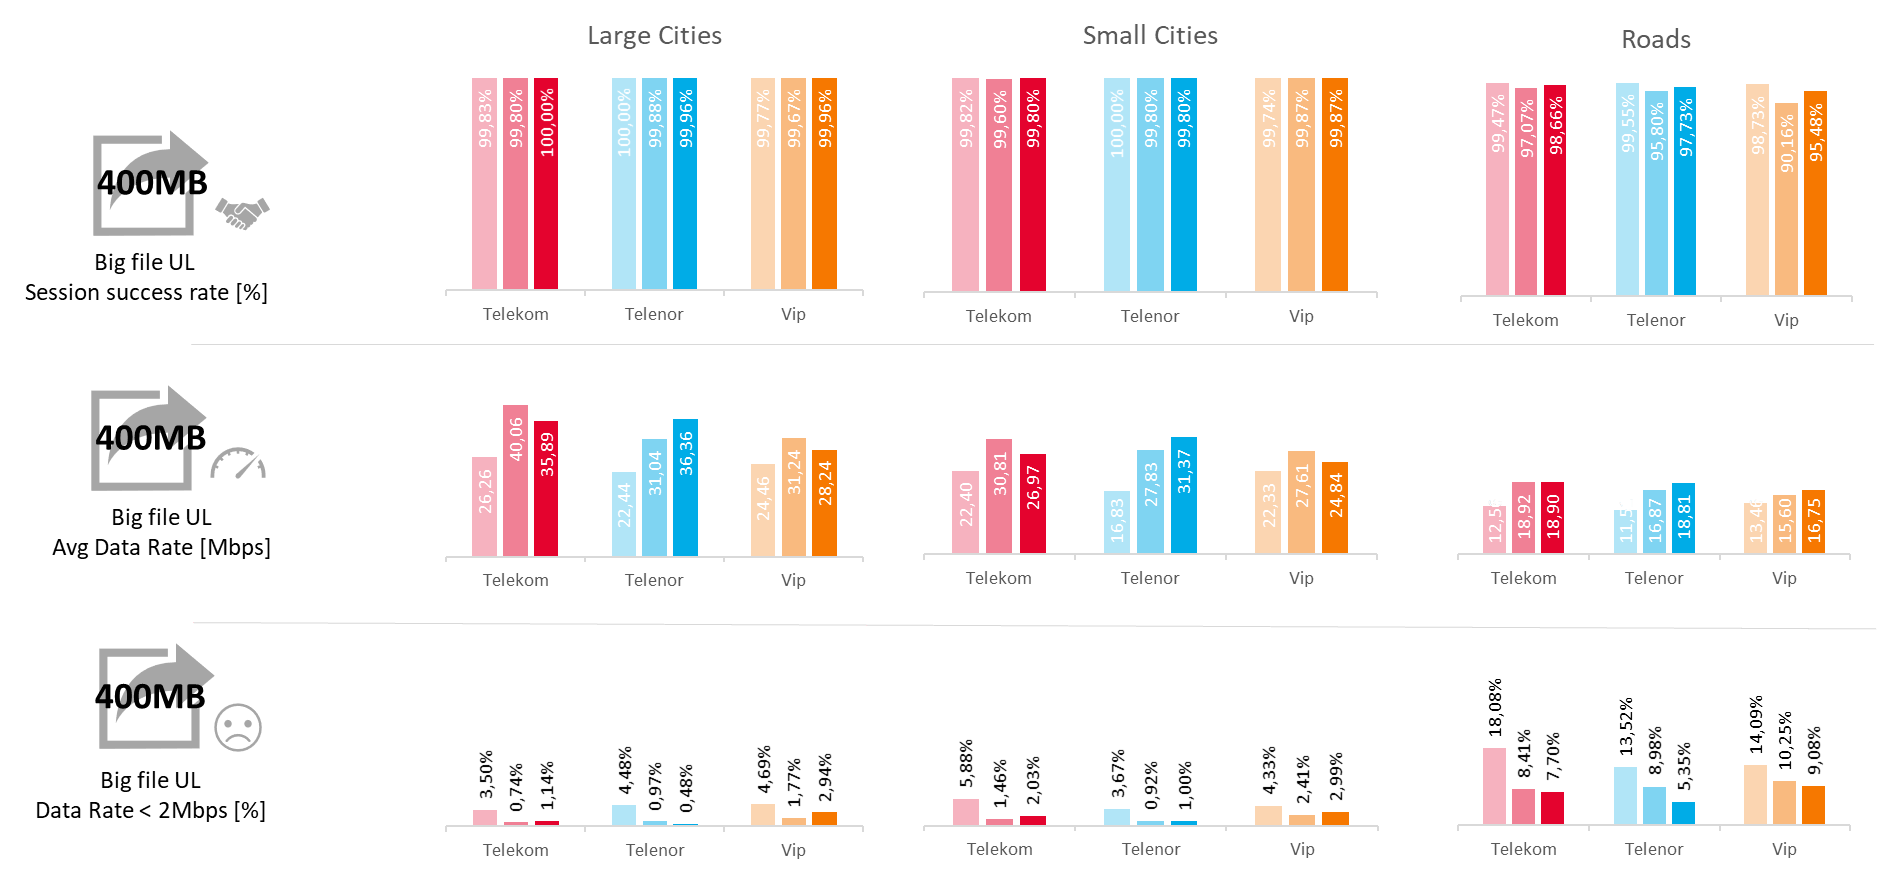
Fig. 10. Selected KPIs from FDTT HTTP UL tests
Session Success Rate provides information about reliability of Internet access for mobile users. Performance of all operators remained stable and on excellent level since 2017. Only on Roads, all operators improved the results comparing to 2019.
Average Data Rates measured during 2020 benchmark confirmed improvement for Telenor in all aggregations. Telekom Srbija and VIP mobile performed poorer than in 2019. On the roads, all operators presented similar results.
Percentage of Tests with Data Rate below 2Mbps is metric which describes portion of the network not satisfying criteria for minimal user satisfaction for Internet connectivity. If data rate is below 2Mbps, users may have troubles with demanding services like uploading photos and video streams to social media platforms, as well as bulk large uploads. Telekom Srbija and Telenor improved in Large Cities and Small Cities, reaching target of <2%. Only VIP mobile did not meet the target in Cities. Results for Roads category were improved in 2020 but still may cause user dissatisfaction and should be improved further.
HTTP Transfer DL
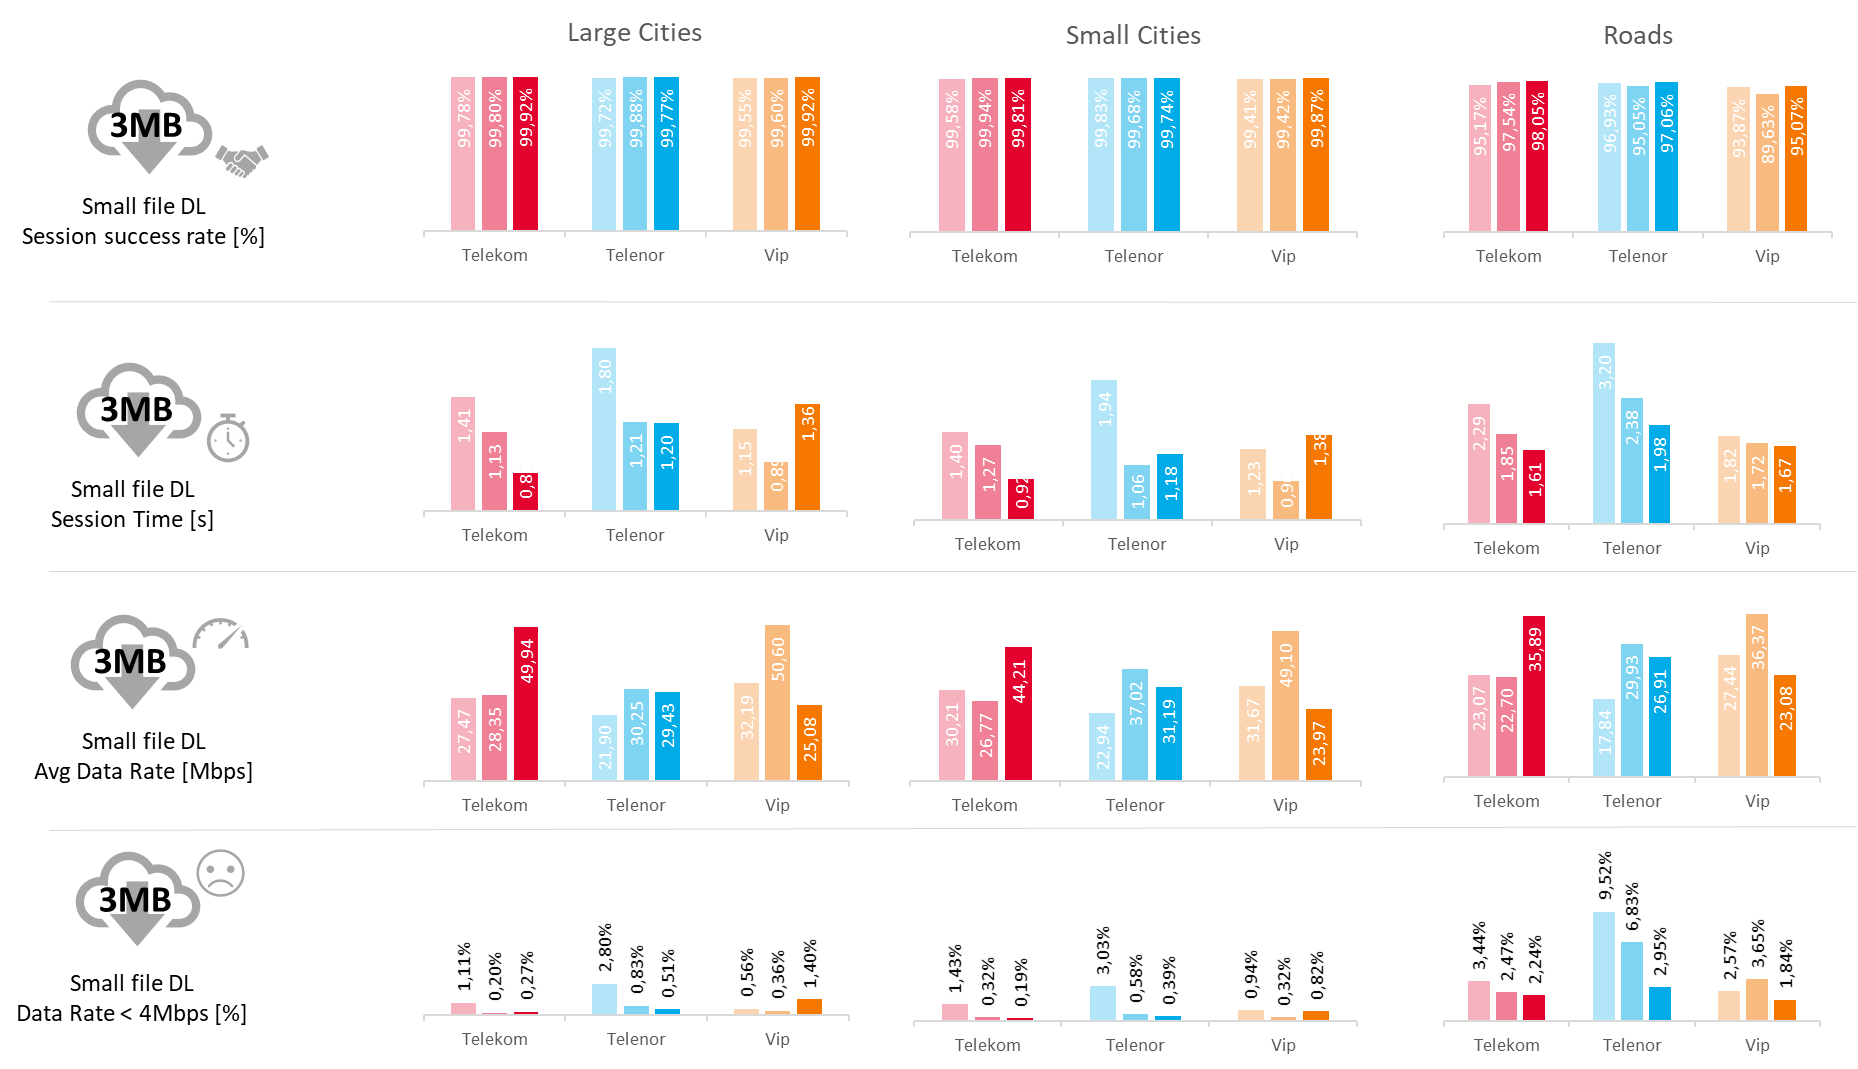
Fig. 11. Selected KPIs from HTTP Transfer DL test
Session Success Rate provides information about reliability of Internet access for mobile users. Performance of all operators remained stable and on excellent level, since 2017, in Large and Small Cities. Differences between operators are not likely to be recognized by the users. On Roads, all operators improved the success rate in 2020.
Session Time & Average Data Rate are complimentary metrics which should be considered together, as they give indication about network flexibility in delivering instantaneous data rates. During this data test, effectiveness of TCP proxy / acceleration mechanisms is evaluated together with radio network performance. Telekom Srbija and Telenor presented improved performance compared to 2019 results. Telekom Srbija is leading in Data Rate with improvement of 20Mpbs and shortest Session Time of 0.8 second. VIP mobile lowered Data Rate and increased Session Time in Cities.
Percentage of Tests with Data Rate below 4Mbps is metric which describes portion of the network not satisfying criteria for minimal user satisfaction for Internet connectivity. During the 2020 benchmark, all operators presented results on a very good level in Cities with only VIP mobile slight increase of bad samples. Despite the improvement on Roads the results still below expectations.
HTTP Transfer UL
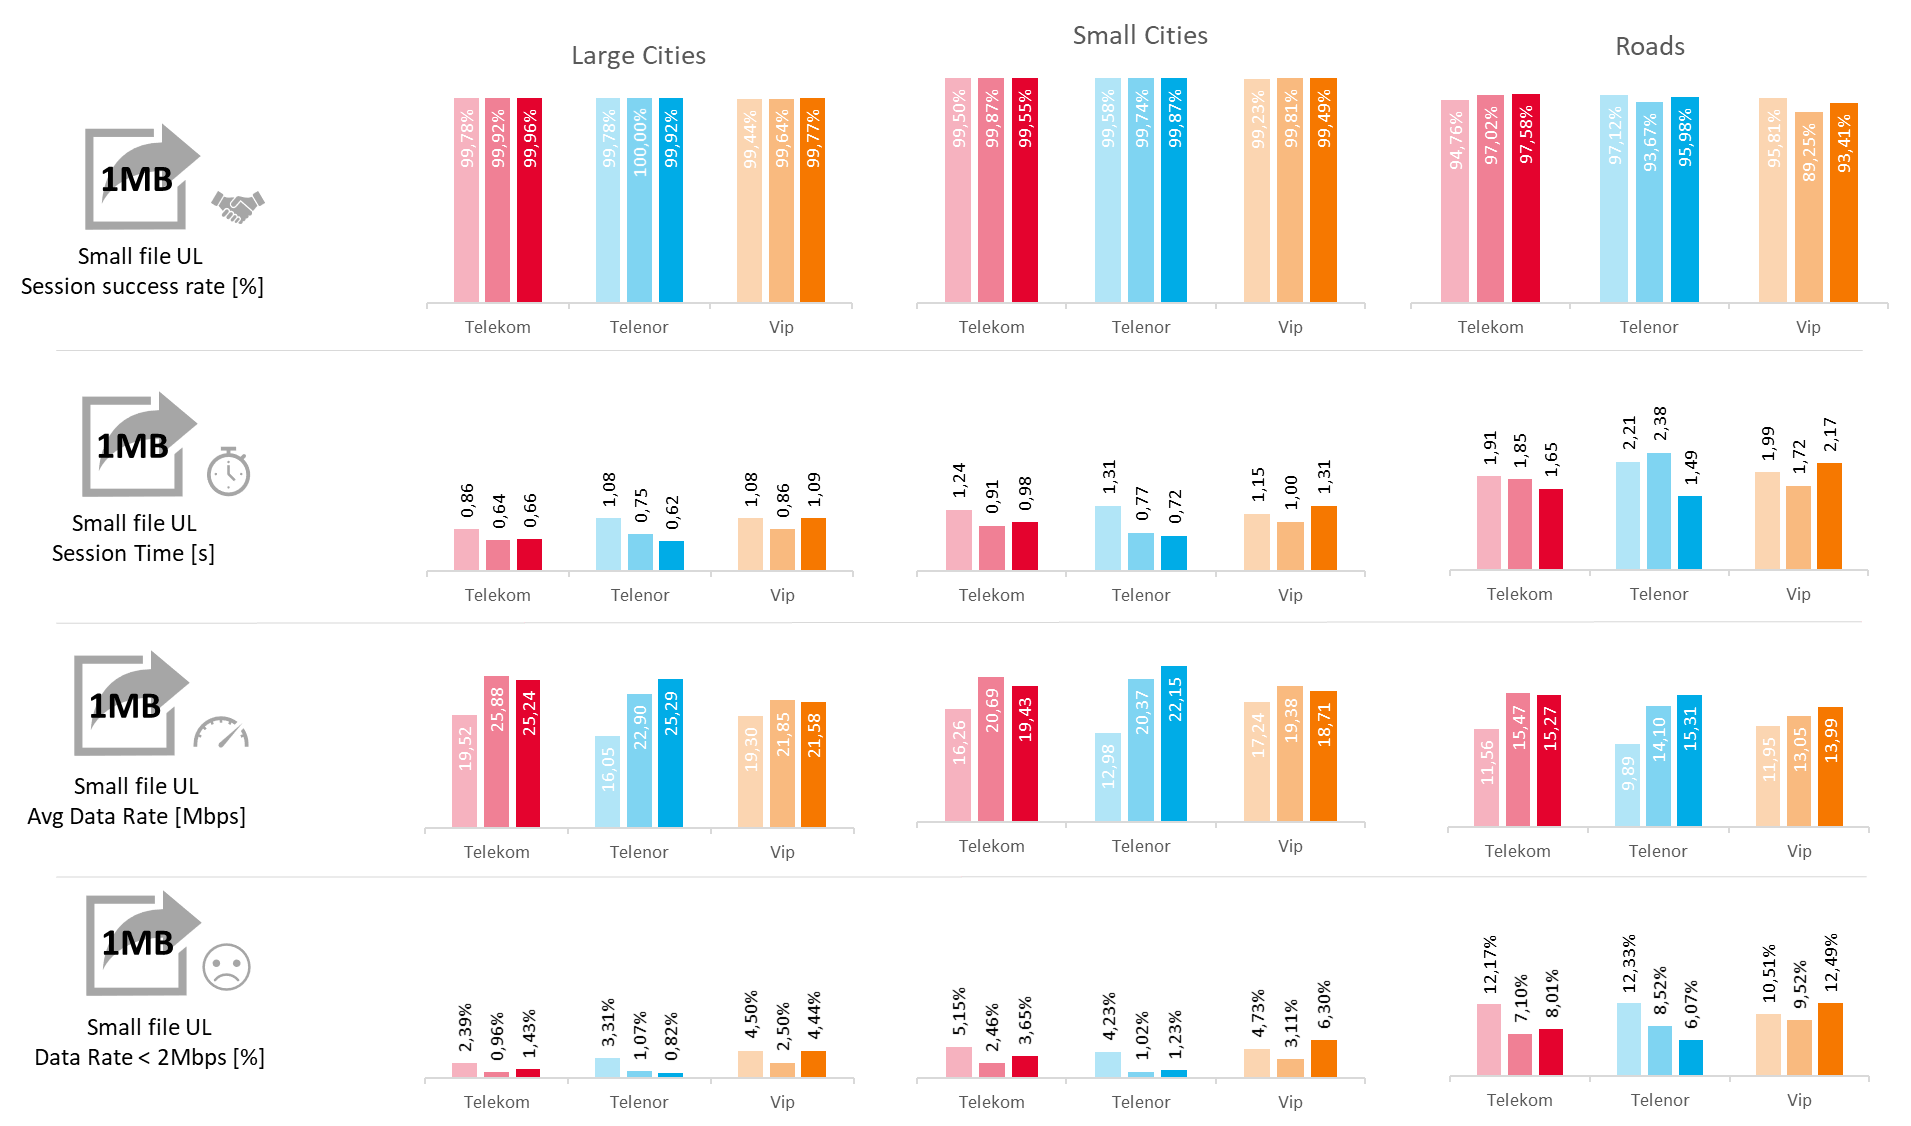
Fig. 12. Selected KPIs from HTTP Transfer UL test
Session Success Rate provides information about reliability of Internet access for mobile users. All operators presented stable and excellent results in Large and Small cities. Roads remained the most challenging area for Uplink data Transfer, as terminals are constrained by transmit power limitations and distance to the base station. All operators improved the service quality in this category. Telekom Srbija was ranking as the best operator. VIP mobile ranked behind competitors despite the biggest improvement to the reliability. Success Rates on roads confirm that limitations of Internet connectivity remain recognizable to end users and should be improved further.
Session Time & Average Data Rate are complimentary metrics which should be considered together, as they give indication about network flexibility in delivering instantaneous data rates. During this data test effectiveness of TCP proxy / acceleration mechanisms are evaluated together with radio network performance. Telenor presented improved results in all aggregations taking the lead in this category. Results of Telekom Srbija and Telenor without noticeable difference by the End User. Roads stayed as the most demanding areas where only Telenor improved both metrics.
Percentage of Tests with Data Rate below 2Mbps is metric which describes portion of the network not satisfying criteria for minimal user satisfaction for Internet access. Overall differences between operators have diminished during 2019 benchmark. Telenor was leading in all aggregations. VIP mobile increased the number of bad samples. For Roads, above 8% of traffic was not satisfying 2Mbps throughput threshold, which would have an impact on user’s perceived quality of the service (e.g. the small files upload becomes prolonged and possibilities of making video calls would be limited).
Browsing
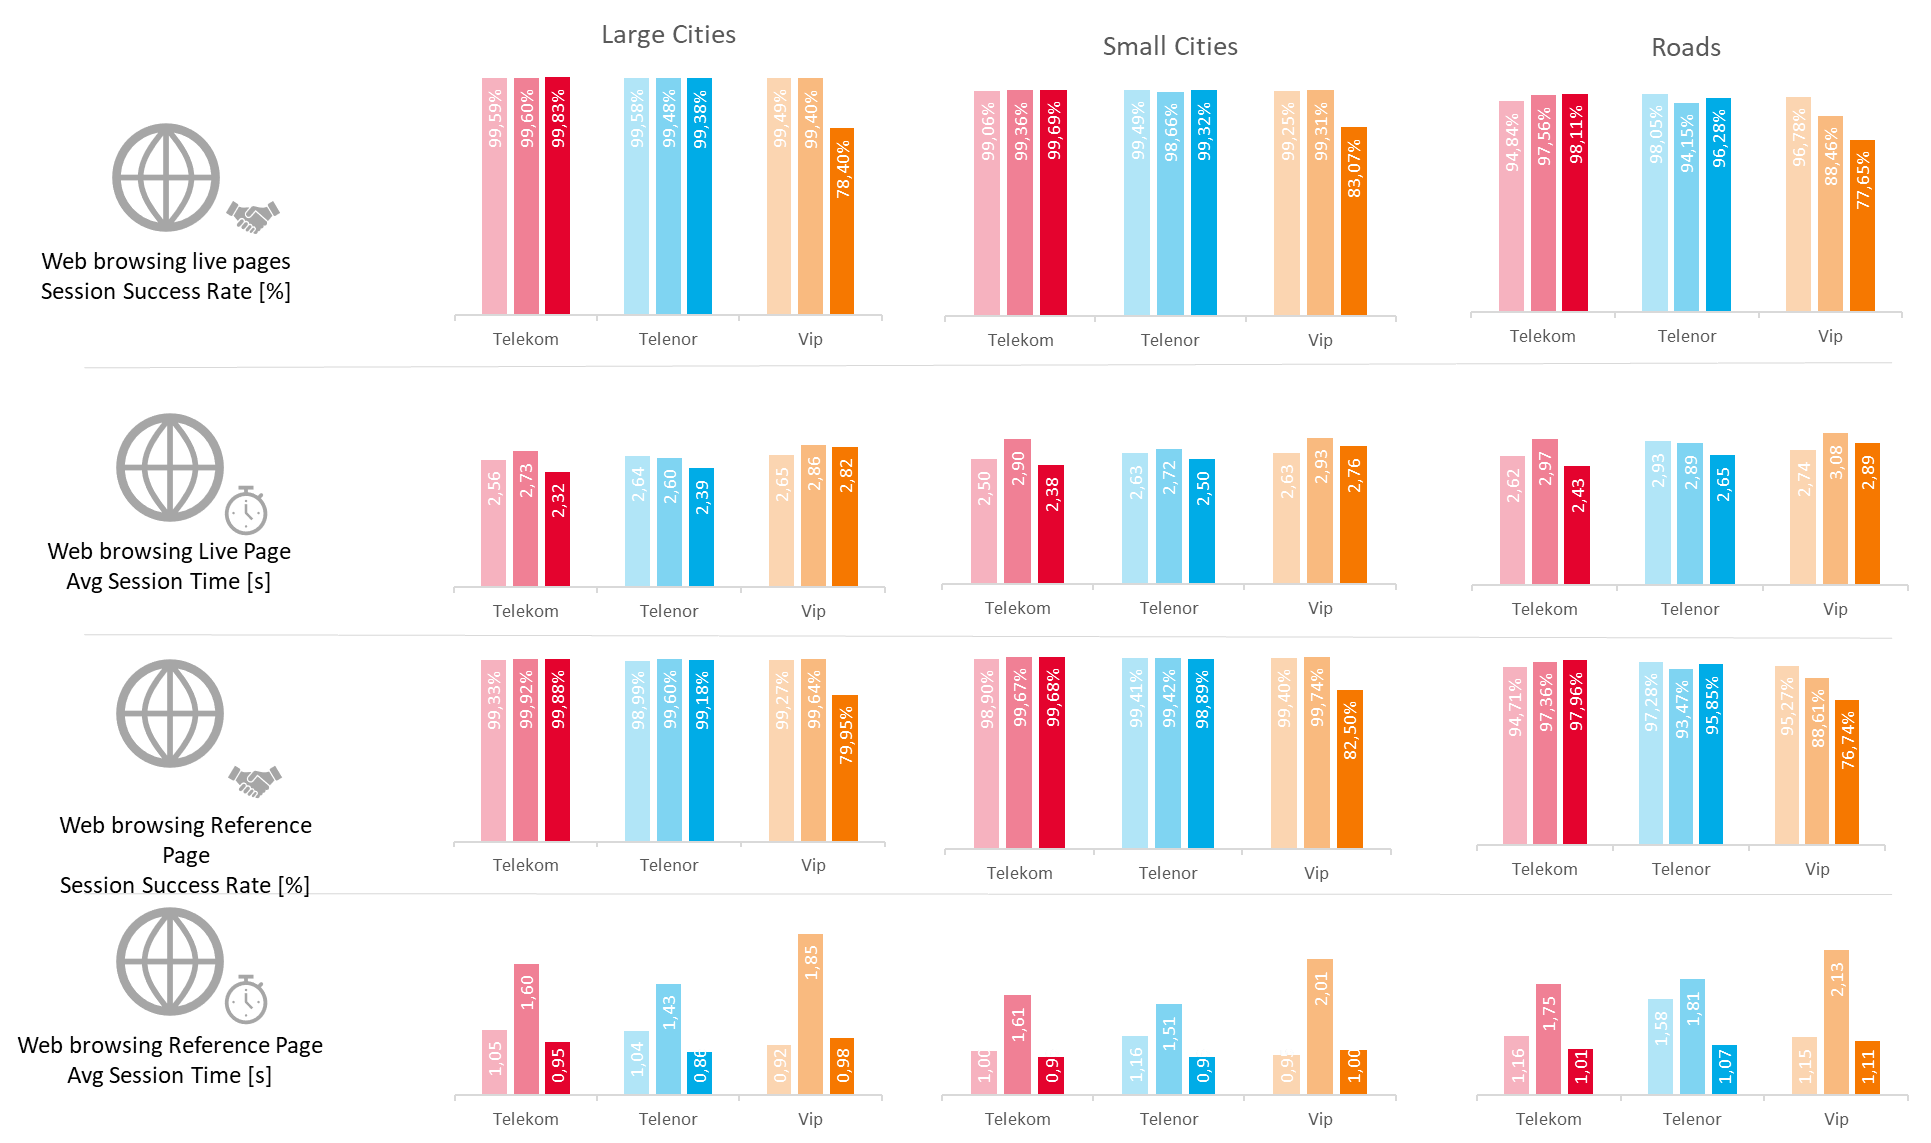
Fig. 13. Selected KPIs from Browsing tests
Live Page Session Success Rate presents the closest reflection of user perception of web browsing. During 2020 benchmark, Telekom Srbija and Telenor showed almost identical performance in Large and Small cities, with differences not recognizable to end user. On the roads, results differentiated, with Telekom Srbija ranking as the best. Vip mobile achieved lower success rates than in previous campaigns due to DNS server issues. Differences between 2019 and 2020 results can be attributed not only to the operators network performance, but also to the changes of live pages content and structure.
Live Page Average Session Time differed between campaigns, due to operators network improvement, as well as live page content and structure – similarly to Session Success Rate. All operators presented very similar performance, with Telenor being slightly better at every aggregation.
Reference Page Success Rate result for this year’s benchmark stayed on the same level for all operators in Large and Small Cities. On Roads, Telekom Srbija and Telenor improved. Differences in performance between Telekom Srbija and Telenor for Large and Small cities are not likely to be recognized by the end users. VIP mobile had lower success rate due to DNS server issues.
Reference Page Session Time results were deteriorated for all operators. Despite general improvement, Telenor was leading in Cities. On Roads, Telekom Srbija and Telenor achieved similar level of results.
YouTube
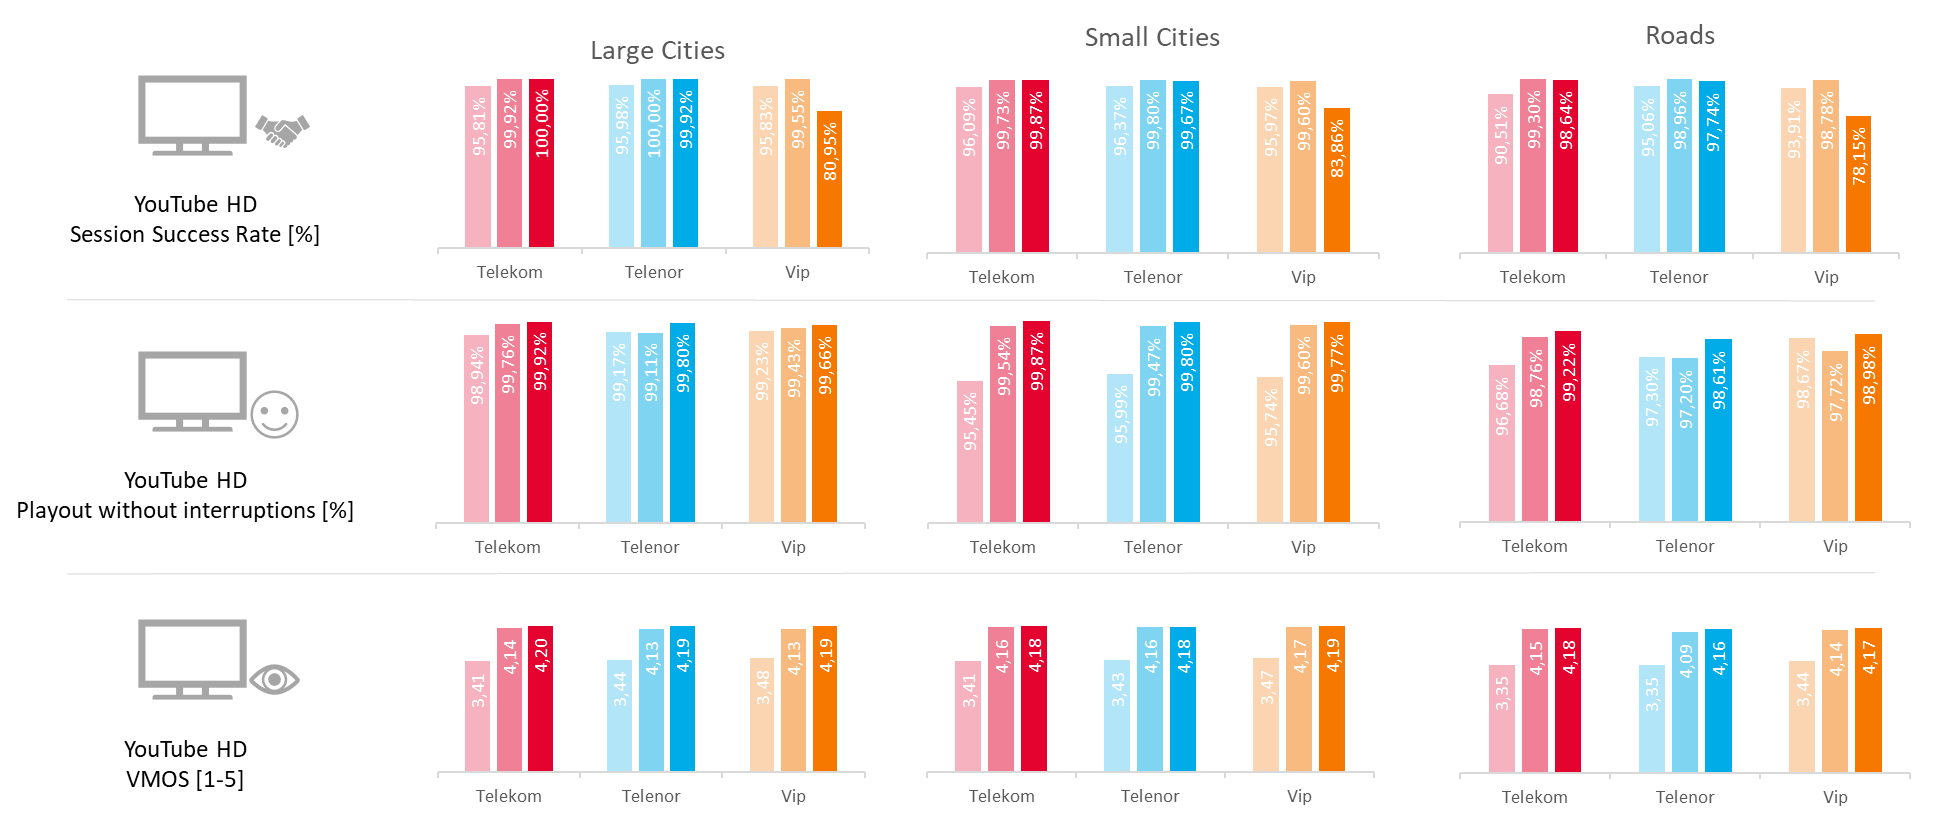
Fig. 14. Selected KPIs from YouTube tests
YouTube Session Success Rate improved for Telekom Srbija and Telenor, across all aggregations. Differences between operators in those categories are not recognizable by the end users. VIP Mobile with lower results comparing to 2019 due to DNS server issues.
YouTube Playout without Interruptions was improved by all operators during 2020 measurements in all aggregations. Operators achieved results on perfect level and the differences between operators were not recognizable by the end user.
YouTube VMOS is complex metrics which reflects all aspects of video quality (Resolution, Interruptions, Blurriness, Blockage, etc.). The results achieved by operators in all aggregations are on the same level and differences are unlikely to be recognized by the end user.
Radio Coverage
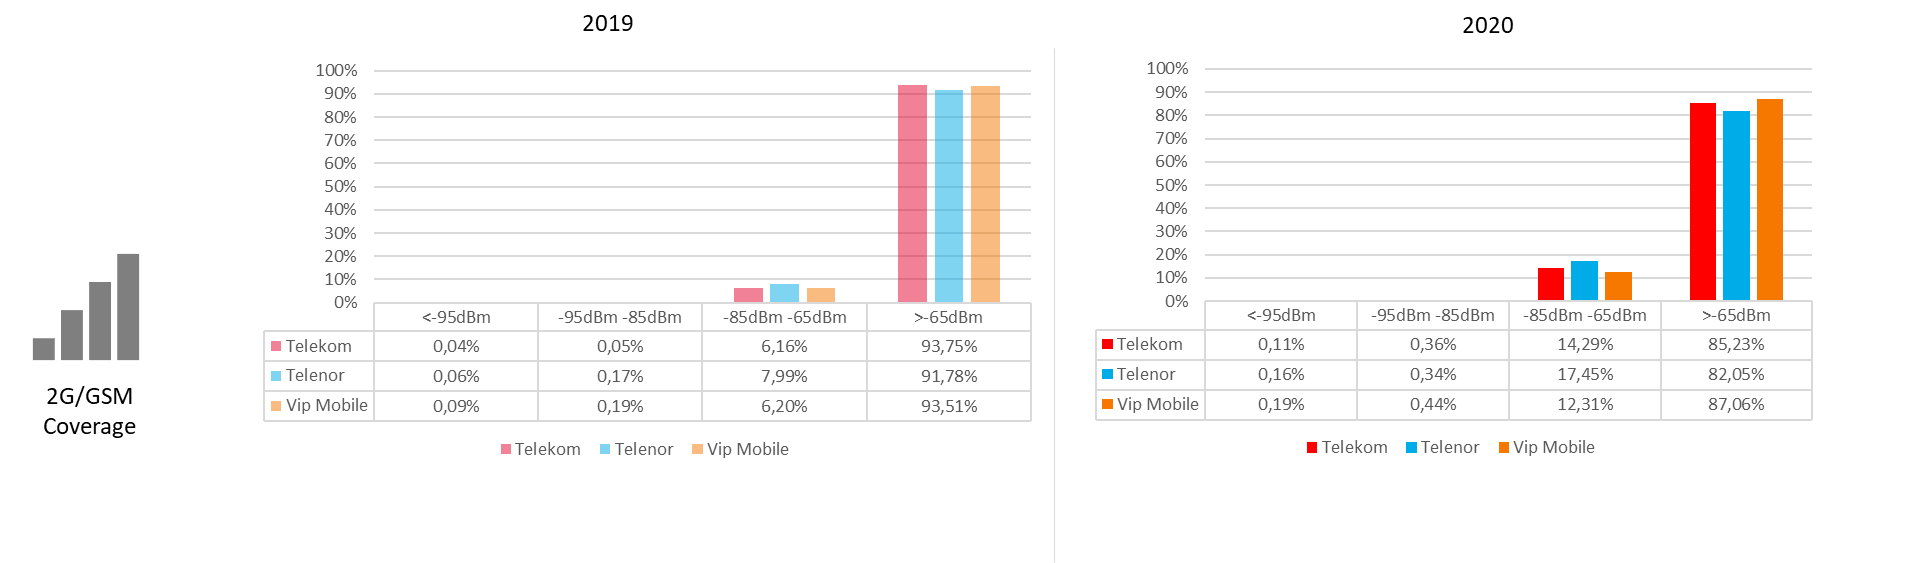
Compared to the previous benchmark campaign, for GSM technology, ~10% shift from excellent to very good category of the samples could be observed for all operators. VIP mobile took the lead.
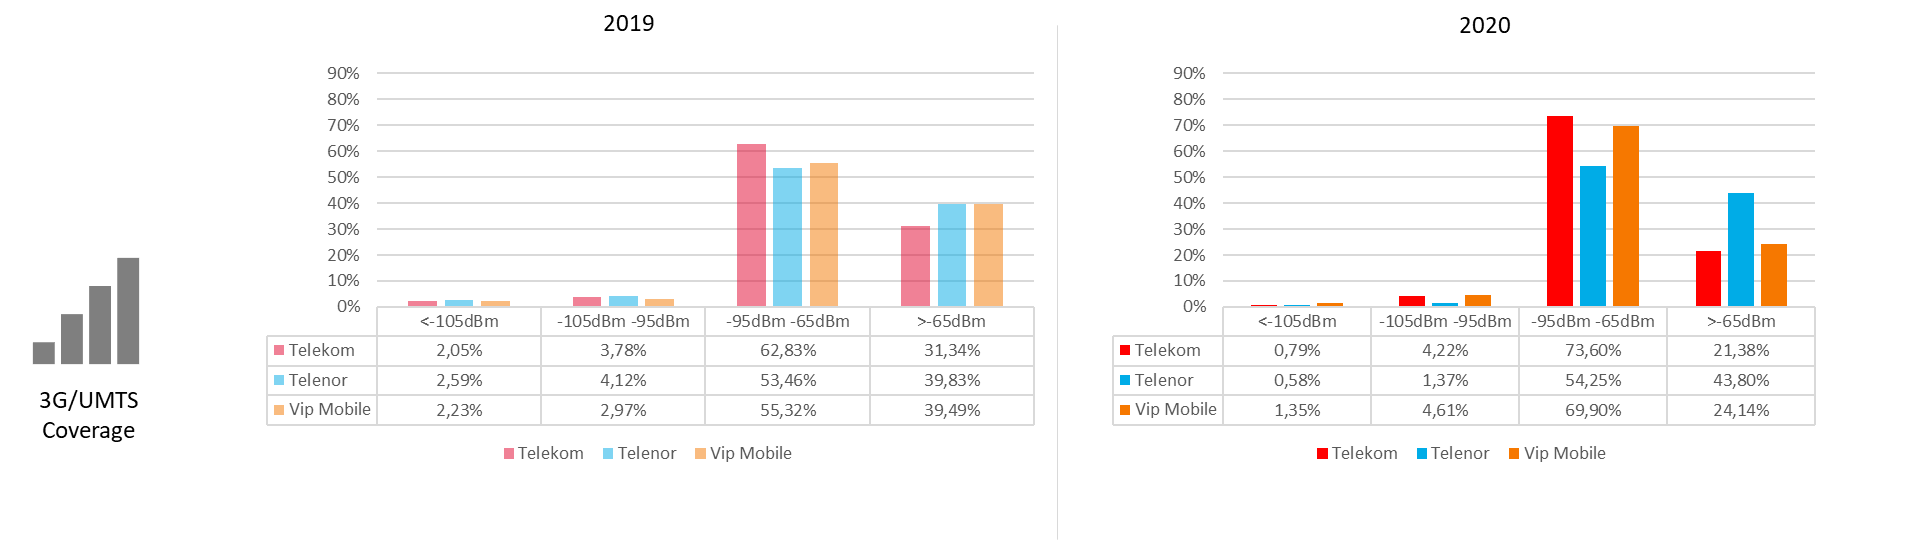
For UMTS technology, a ~12% shift from excellent to very good category can be noticed for Telekom Srbija and VIP mobile. Telenor presented a ~5% shift from bad to excellent category taking the lead.
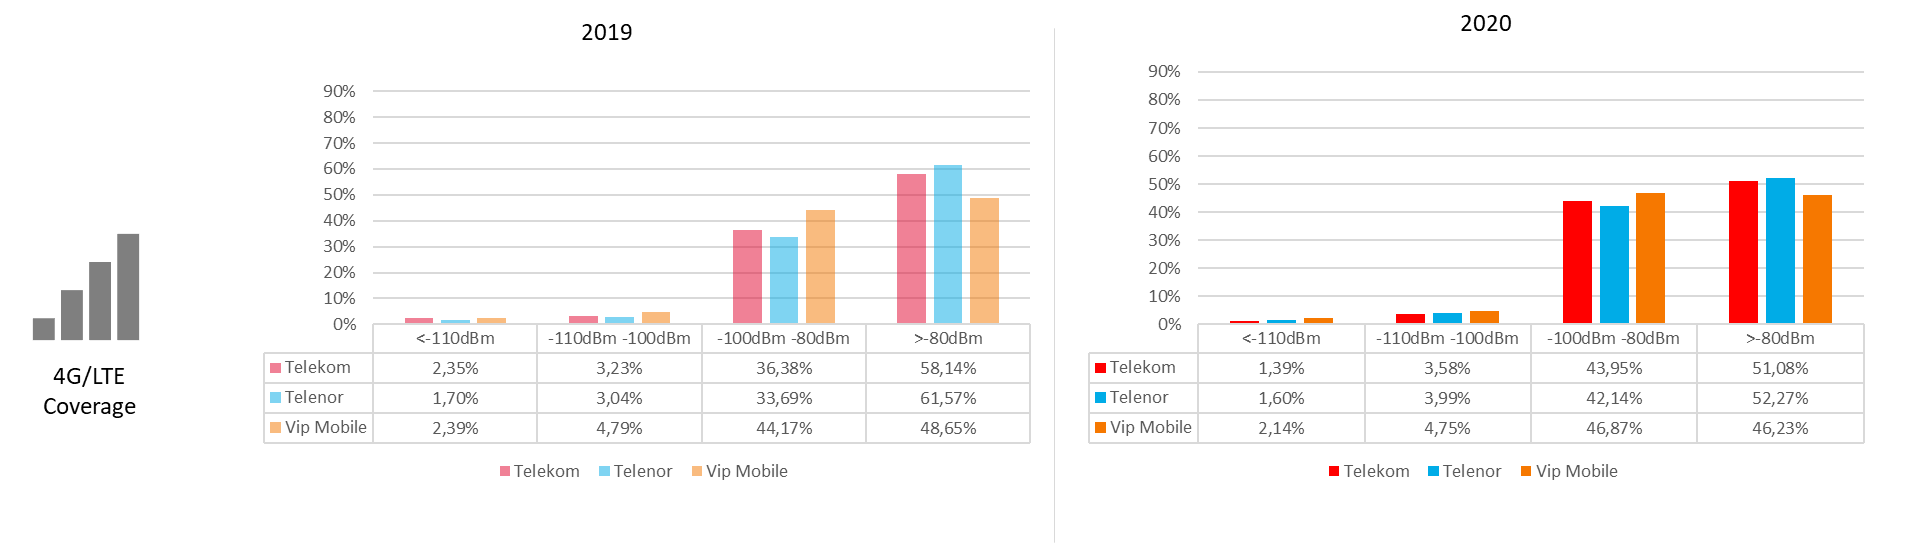
Compared to the previous year, Telekom Srbija and Telenor had 8% less samples in the excellent category. Vip mobile coverage improved very slightly, with 1% more samples in excellent category.