Drive Test
The campaign covered 50 cities and 10,000 km of Serbian roads and was divided into three area type categories: Large Cities, Small Cities and Roads. The number of tests samples collected during drive tests (in each network over 7000 voice calls and around 7000 of every data service tests were done) allows to receive accuracy better than 3% for standard error with confidence level better than 95%.
Drive test routes that were measured, are presented in Figure 1.

Fig. 1. Drive test routes
Measurements were performed in a drive test mode, which means that the measurement equipment was installed in moving vehicles. Measurement equipment collects network data by running voice and data tests and using a scanner to obtain radio network parameters. All three mobile networks were measured at the same time and on the same drive test routes using the same smartphones – Samsung Galaxy S10 for voice and Samsung Galaxy S9 for data. The Samsung Galaxy S10 was equipped with operators’ firmware to support all latest networks features (including VoLTE – Voice over LTE calls). The Samsung Galaxy S9 is a Cat. 18 mobile device, which means that it supports 4G (LTE) data speeds up to 1200 Mbps for data receiving and 300 Mbps for data sending. All smartphones worked in automatic technology selection mode. To reflect the latest technical developments in the mobile networks and to examine the benefits from available capabilities, SIM cards with the most comprehensive mobile tariff plans (tariff plans with the highest data rates, highest number of minutes, largest amount of data volume) available from each operator were used.
Mobile Tariff plans used for testing networks are shown in Table 1:
| Operator | Tariff plan used for voice tests | Tariff plan used for data tests |
|---|---|---|
| Telekom Srbija | SOKO | SOKO |
| Telenor | Total 30 | Biznis Total 100 |
| Vip mobile | NEO100 | Vip Online |
Table 1. Mobile Tariff plans – Drive test
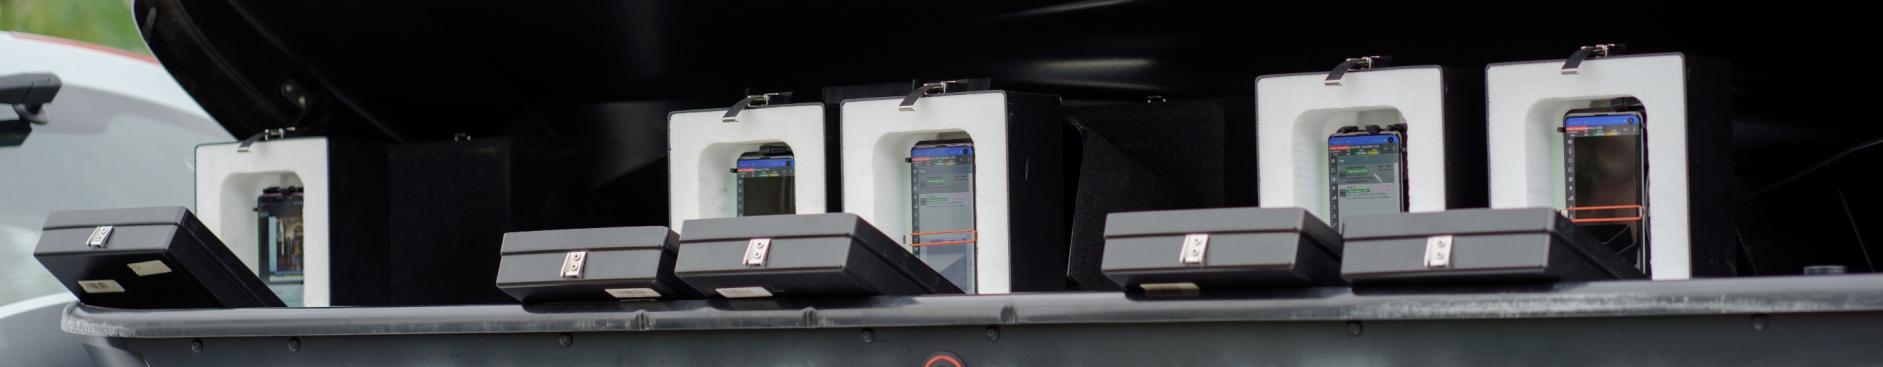
The measurement system consisted of two test cars equipped with identical measurement equipment (SwissQual Diversity Benchmarker II) capable of measuring all network technologies and services simultaneously to a very high accuracy. In order to perform voice tests, the Samsung Galaxy S10 smartphones permanently called each other, within the same mobile network. In Large Cities, voice tests were executed in mobile to mobile scenario between two cars, in Small Cities and on the Roads mobile to mobile calls were performed within the same car. The aforementioned specific setup in Large Cities allowed for effective data collection without performing too much voice traffic within the single radio cell in areas where higher mobile traffic is expected. Voice tests assess network accessibility, retainability and quality of speech. Voice calls with 85 seconds call duration were measured during benchmarking.
Test equipment installed in cars is presented in Figure 2.
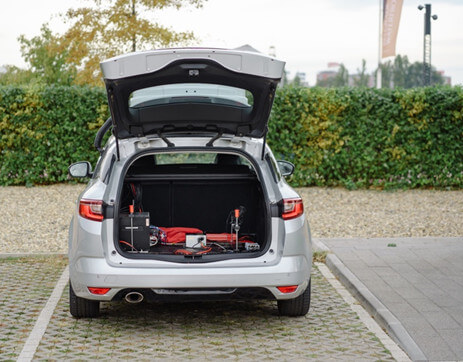
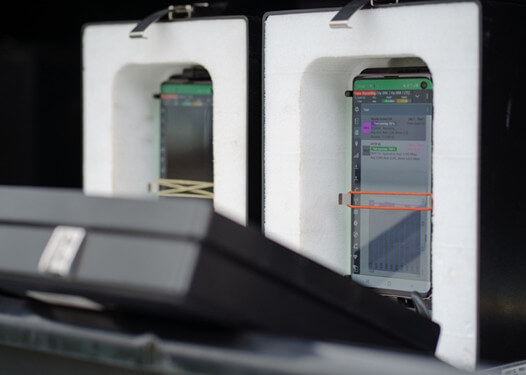
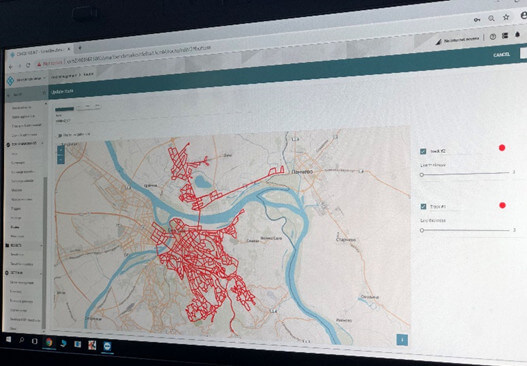
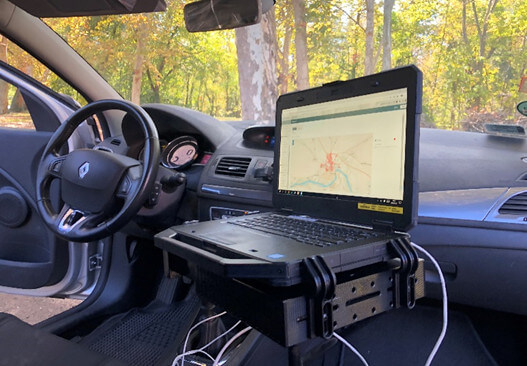
Fig. 2. Test Equipment installed in cars
The receiving or sending of additional data during the voice test call was added to the measurement scenario in order to simulate behaviour of a regular subscriber using a smartphone device, for which background data transmissions are typical during the voice call. For each of the voice calls, the quality of speech samples was measured (MOS – Mean Opinion Score) using the standard POLQA P.863 algorithm.
Data tests were performed using Samsung Galaxy S9 smartphones and a dedicated measurement server located at the Serbian Open eXchange (SoX) in Belgrade, which ensured a fair transmission path to all three mobile networks. Data tests assess the network availability, stability, typical performance and highest capabilities. The most representative data services measured during benchmarking were:
To simulate the behaviour of average mobile subscriber in Serbia surfing the Internet, a set of websites was tested, based on their popularity amongst Serbian users:
https://www.twitter.com
https://www.facebook.com
https://www.kupindo.com
https://oglasi.rs/
In the YouTube test, the quality of a live stream was measured (VMOS - Video Mean Opinion Score) using the standard J.343.1 algorithm.
A scanner (Rhode&Schwarz TSME) was used to test radio parameters of the mobile networks. SwissQual NQDI software was used for network data post-processing and reporting. The post-processing activity was supported by the use of the Systemics-PAB proprietary Data Warehouse for a customized analysis.
Walk test
The campaign covered 4 locations in Belgrade.
Measurements in walk test locations were performed in a nomadic mode, which means that the measurement equipment was installed in a backpack carried by measurement engineer.
Measurement equipment collects network data by running voice and data tests and using a scanner to obtain radio network parameters. All three mobile networks were measured at the same time and on the same walk test routes using the same smartphones – Samsung Galaxy S10 for voice and Samsung Galaxy S9 for data. The Samsung Galaxy S10 was equipped with operators’ firmware to support all latest networks features (including VoLTE – Voice over LTE calls). The Samsung Galaxy S9 is a Cat. 18 mobile device, which means that it supports 4G (LTE) data speeds up to 1200 Mbps for data receiving and 210 Mbps for data sending. All smartphones worked in automatic technology selection mode. To reflect the latest technical developments in the mobile networks and to examine the benefits from available capabilities, SIM cards with the most comprehensive mobile tariff plans (tariff plans with the highest data rates, highest number of minutes, largest amount of data volume) available from each operator were used.
Mobile Tariff plans used for testing networks are shown in Table 2:
| Operator | Tariff plan used for voice tests | Tariff plan used for data tests |
|---|---|---|
| Telekom Srbija | SOKO | SOKO |
| Telenor | Total 30 | Biznis Total 100 |
| Vip mobile | NEO100 | Vip Online |
Table 2. Mobile Tariff plans – HotSpots
The measurement system consisted of the backpack (SwissQual Freerider III) equipped with identical measurement terminals capable of measuring all network technologies to a very high accuracy. In order to perform voice tests, the Samsung Galaxy S10 smartphones permanently called each other, within the same mobile network. Voice tests were executed in mobile to mobile scenario between terminals in the same backpack. The Samsung Galaxy S9 was used to perform data tests. The same Voice and Data scenarios, as in the drive test, were used for hotspot measurements.
A scanner (Rhode&Schwarz TSME) was used to test radio parameters of the mobile networks. SwissQual NQDI software was used for network data post-processing and reporting. The post-processing activity was supported by the use of Systemics-PAB proprietary Data Warehouse for a customized analysis.
Test equipment used in Walk Test measurements is presented in Figure 3.
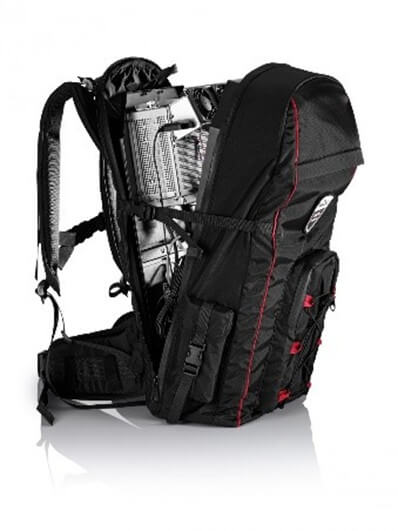

Fig. 3. Test Equipment used in Walk Test measurements
The Walk Test measurements do not influence the scoring results. As the scope of this campaign was limited, it does not provide the number of voice calls and data service tests to support scoring principles.
The scoring methodology was developed for assessing user perception of voice, data and video services after the benchmarking measurements, with the purpose of assessing the ranking of the measured mobile network operators.
The main challenge is to select Key Performance Indicators (KPIs) which represent true user experience, and to develop the algorithm which allows the calculation of the unified quality metric for every operator – the score. In the Systemics-PAB approach, the score reflects user experience and is focused on issues which have high influence on users’ dissatisfaction.
For every service tested, there are at least two metrics identified as meeting the above mentioned idea of scoring.
The usability of the service is assessed using Call or Session Success Rate (CSR for voice tests or SSR for data tests). CSR/SSR is an indicator tested for all types of the services and it is considered as a ratio of successful tests (successful setup and correct termination) to all test attempts. The exact method of calculation is presented with the formula below:
| CSR/ SSR = | all test attempts for the service – failed attempts – dropped connections |
| all test attempts for the service |
The second metric is the quality of the given service itself. This metric will depend on the type of test executed. For voice calls it is assessed as speech quality, while for data tests it is assessed as data throughput, session time or video stream quality in case of YouTube tests. For services where it is important to have the consistent quality of the service, the usability of the service is additionally assessed by calculating the percentage of tests or samples with bad quality (voice samples with a MOS <2.3 for voice tests, data transfer tests with a throughput below the minimum expected value). This approach reflects how the network is dealing with the consistency of quality (distribution of the quality of the service should be close to an average value).
MOS stands for Mean Opinion Score for quality of voice services. It measures subjective perception of the voice quality by the listener. It ranges between 1 and 5, with 5 being the best.
For each of the KPIs measured, there is a threshold assumed as a minimum requirement which has to be met in order to achieve scoring points. This threshold is set at the level representing the status of technology development (minimum data throughputs meeting assumptions for the implementation of the 3G or 4G technologies), the usable quality of service (MOS threshold below which speech quality is poor), network accessibility levels, corresponding to the grade of service used for telecommunication services.
The quality KPIs also have maximum values used for scoring calculations, which is interpreted as a target above which users do not feel the real difference in quality of service, and due to this effect, it is not a differentiating factor in the user’s perception. Operators are not awarded with additional points for exceeding this maximum threshold.
For all KPIs, a linear function is used to calculate how a given KPI meets expectations (within min-max ranges). If a higher value of the KPI is better, the particular score is calculated straight forward (i.e. speech quality or throughput), if a lower value is better, calculations are performed in a reversed way (i.e. call setup time or share of samples with low throughput).
Data gathered during benchmarking tests are used to calculate ranking scores for all measured mobile operators for voice and data services.
The importance of the voice service is set to 40%, while all data services sum up to a total of 60%.
The first step for calculating the single score is to calculate the score for the different aggregations as:
Particular area scores are calculated separately using the defined weights and thresholds for types of services tested. The final score is a weighted aggregation of the scores obtained in these areas. The areas scores contribute to the final scoring with weights relevant to their importance. The following weights are used for the aggregations: Large Cities 40%, Small Cities 30% and Roads 30%.
The final score, the same as the scores for each of the individual areas, is presented as single percentage value which can be interpreted as level of fulfilling expectations/capabilities. It ranges from 0 to 100 percent. The scoring calculation process is presented in Figure 5.
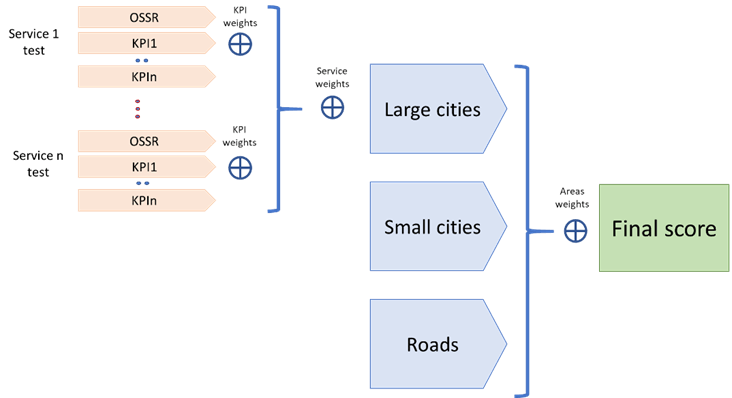
Fig. 5. Scoring calculations